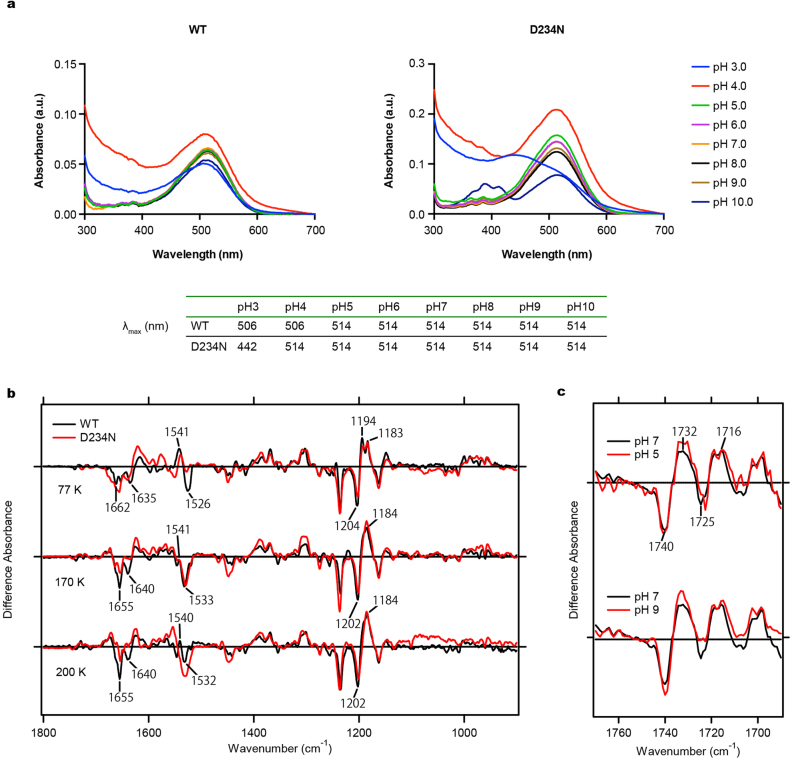
Extended Data Fig. 9. Spectroscopic characterization of wild-type GtACR1 and the D234N mutant.
a, Absorption spectra of wild-type GtACR1 (top left) and the D234N mutant (top right) measured from pH 3.0 to 10.0. The λmax value at each pH is listed in the table (bottom). b, Difference FTIR spectra of wild-type GtACR1 and the D234N mutant measured at 77 K, 170 K and 200 K. c, Difference FTIR spectra of wild-type GtACR1 in the 1,690–1,770 cm−1 region measured at pH 5.0, 7.0 and 9.0. Forty identical recordings at 77 K and seven identical recordings at 170 K and 200 K were averaged.

