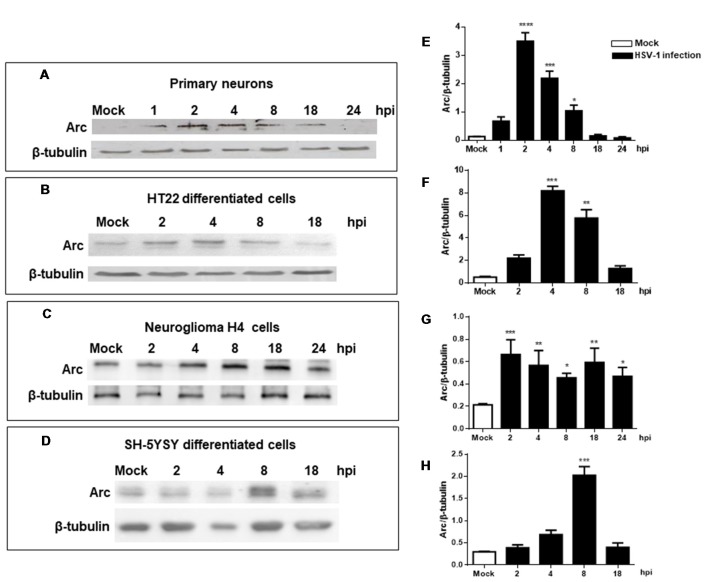
Figure 2.
Increased levels of Arc protein during in vitro neuronal HSV-1 infection. Immunoblot analyses showing Arc and β-tubulin proteins, in either non-infected (Mock or M) or HSV1-infected brain cells multiplicity of infection (MOI = 10). (A) Mouse primary culture neurons. (B) Differentiated HT22 cells. (C) Neuroglioma H4 cells. (D) Differentiated SH-SY5Y cells. Infections were performed at 1, 2, 4, 8, 18 and 24 hours post-infection (hpi). (E–H) After gel scanning and densitometry quantitation, the results were expressed as the ratio of Arc protein levels respect to total tubulin. The blots are representative of three independent experiments. ****p < 0.0001; ***p < 0.001; **p < 0.01; *p < 0.05 (analyzed by One-Way ANOVA, followed by Tukey’s multiple comparisons Test).

