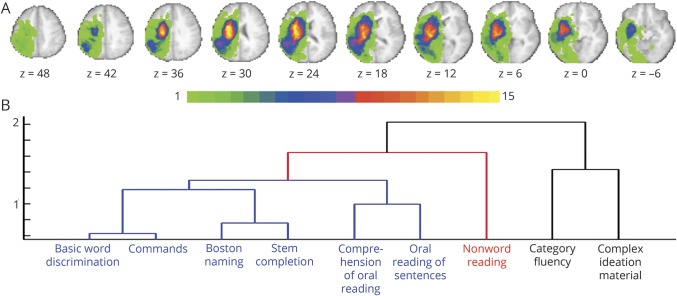
Figure 1. Lesion topography and clustering of behavioral tests.
(A) Lesion density in the sample of patients (n = 33) for left-hemisphere lesions. The color bar indicates the number of patients with a lesion in a given voxel. (B) Dendrogram derived from applying a clustering algorithm to the correlation matrix for the behavioral tests. Blue, red, and black colors indicate tests failing in the comprehension/lexical semantic, grapheme-phoneme knowledge, and verbal executive clusters, respectively.

