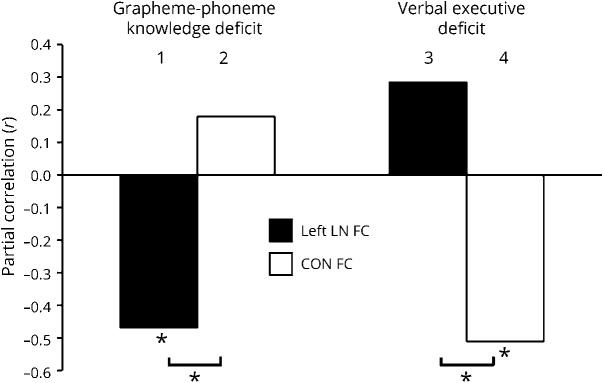
Figure 4. Partial correlations between behavioral deficits and FC.
The bar graph plots 4 FC and behavior partial correlation coefficients (r Pearson) derived from the FC of the left LN (left LN FC, black) and FC of the CON (CON FC, white). Bars 1–2 and 3–4 indicate correlations involving the grapheme-phoneme knowledge deficit and verbal executive deficit, respectively. Each partial correlation coefficient, e.g., bar 1, is obtained by correlating a given behavior, e.g., grapheme-phoneme knowledge deficit, with the FC derived from a given network, e.g., left LN FC, statistically removing both the other behavior, e.g., verbal executive deficit, and the FC derived from the other network, e.g., the CON FC. *p < 0.05 false discovery rate–corrected. CON = cingulo-opercular network; FC = functional connectivity; LN = language network.

