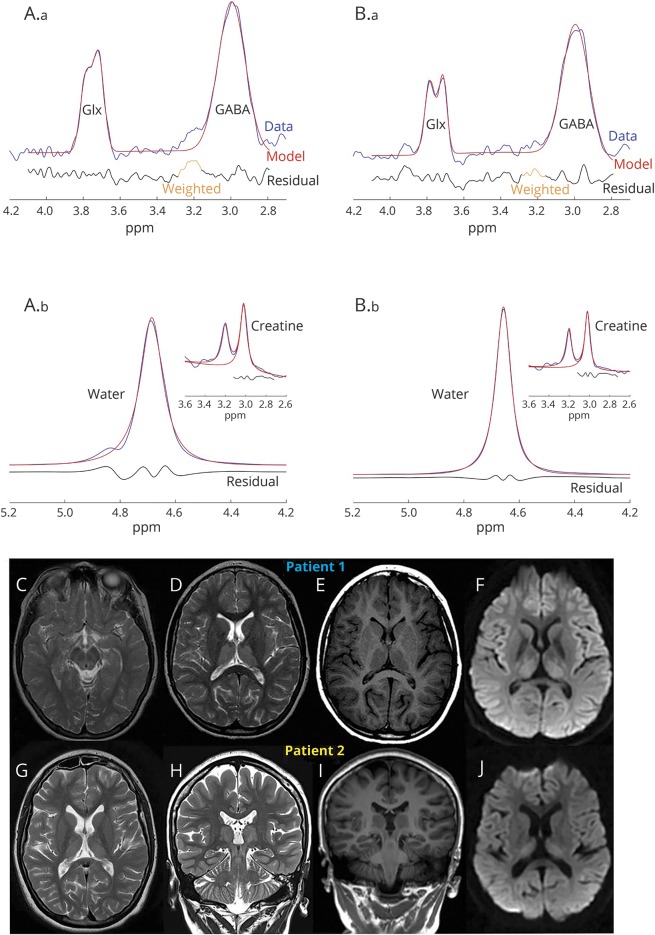
Figure. 1H magnetic resonance spectroscopy (MRS) quantification of GABA and MRI of the patients with GABA transaminase deficiency.
(A.a, B.a) (Patients 1 and 2, respectively) modeled data (red), raw GABA + signal (blue), and residuals (black) exemplifying the accuracy of the GABA spectroscopy data fit. Representative water data (insert: unedited raw data at 3.0 ppm highlighting creatine and choline peaks) (A.b, B.b). The 1H-MRS quantification of GABA (not shown in figure) showed increased levels in the thalamus (patient 1, GABA = 3.99 mM; patient 2, GABA = 4.46 mM) and occipital lobe (patient 1, GABA = 3.72 mM; patient 2, GABA = 2.79 mM) in both patients (normal range 0.5–2.0 mM). See also data supplemental material (doi.org/10.5061/dryad.d6140fj) for 1H-MRS acquisition and analysis protocol. The MRI of patient 1 at age 10 years shows T2 sequence upper midbrain (C) and thalamic hyperintensities (D) and T1 hypointensity (E). Diffusion-weighted imaging (DWI) restriction is seen in the thalamus (F). MRI of patient 2 at age 19 years demonstrates similar findings with symmetric hyperintense signals in thalamus (G) and midbrain (H) in the T2 sequences that are also hypointense in T1 sequences (I). DWI sequences show diffusion restriction in the thalamus (J).

