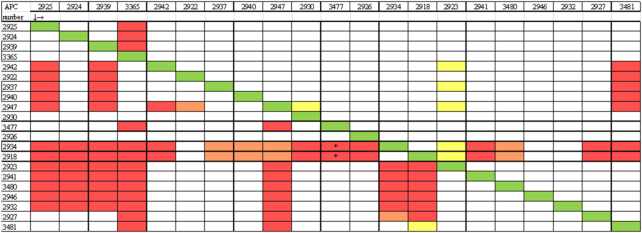
Figure 2.
Cross-immunity assays using CFS from all the antimicrobial-producing strains tested against themselves and each other, with the list of antimicrobial-producing isolates down the left-hand side and the indicator strains across the top of the table. The diagonal green line  reveals that the antimicrobial producer is immune to its own antimicrobial, as expected. The red box
  represents inhibition of the indicator strain indicating that these strains might be different or sensitive to each other.
  (orange) = small/ medium hazy zones.
  (yellow) = very small zones but sensitive. White boxes represent no inhibition, revealing target strains not inhibited by the producing strain, indicating they are immune (related) to the bacteriocins produced by other producers. * = initially sensitive but bactostatic activity observed.

