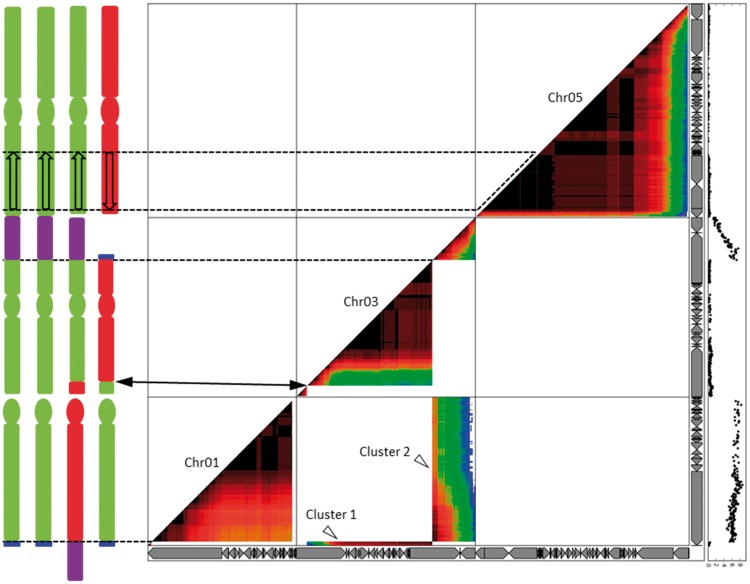
Fig. 3.
Pairwise association of B genome specific SNPs in AAAB×AA progeny projected on chromosomes 1, 3, and 5 of the A genome reference assembly. Chromosomes 1, 3, and 5 of the Musa acuminata reference genome assembly are represented by horizontal and vertical gray arrow boxes (each one representing a scaffold). The marker linkage/pairwise association is represented by a warm-cool color gradient from dark red to blue for strong linkage and weak linkage, respectively. The black curve on the right represents segregation distortion (calculated as the log10P value of the χ2 test to assess the deviation from the expected Mendelian segregation ratio). Two clusters of B markers linking two independent A reference chromosomes corresponding to the reciprocal translocation detected in PKW (fig. 2) are observed (Clusters 1 and 2, open arrowheads). No recombination was detected (dash line) in the region corresponding to the inversion in PKW as compared with the A reference genome. The putative karyotype of the tetraploid CRBP39 is indicated on the left. Vertical bars represent chromosome arms, circles represent centromeric regions and A/B chromosome segments are in green and red, respectively. Structural variations are indicated in the chromosome bodies (translocated fragments: T1 = blue, T3 = purple; inverted fragment = open arrow) and connected to the dot plot with black lines. In chromosome 3, the black arrows indicate a breakpoint in genetic linkage, potentially corresponding to an A/B recombination breakpoint in the CRBP39 chromosome.

