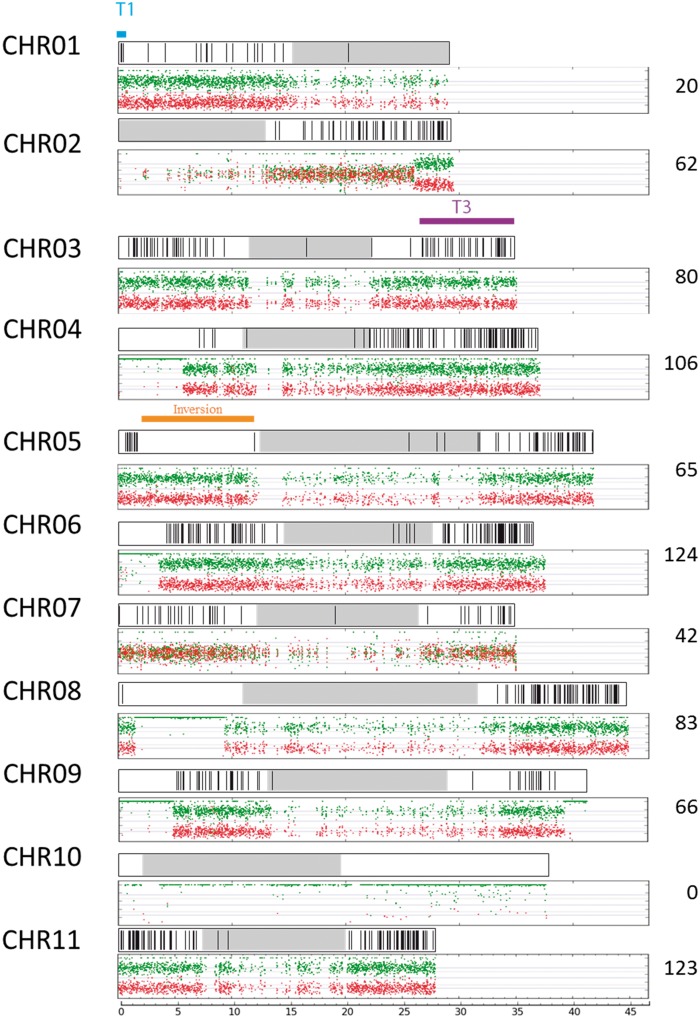
Fig. 4.
Interspecific A/B recombination detected in the CRBP39 “AAAB” progeny. The A/B mosaic genome structure of the 11 chromosome sets of the parent CRBP39 “AAAB” are represented based on the A reference chromosome assembly (bottom box) (see fig. 1 legend). Interspecific recombination breakpoints (black vertical lines) recorded in the 180 progenies from CRBP39×Pahang are plotted on the A reference chromosome assembly (top box). The total number of breakpoints per chromosome recorded in the 185 progenies is indicated on the right. Large structural variations between the A and B genome are indicated in blue and purple for reciprocal translocation (T1, T3) and orange for inversion.

