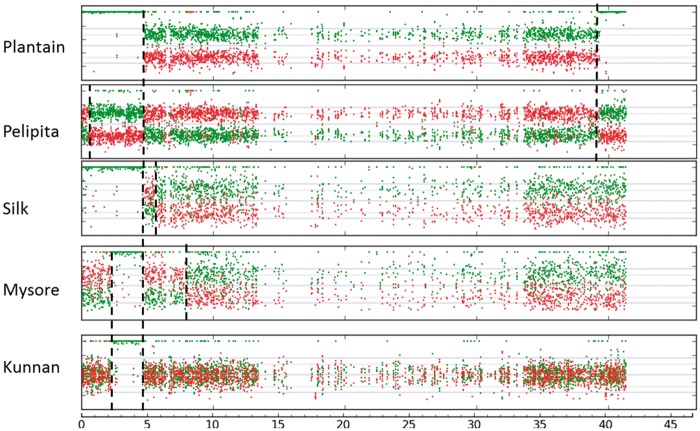
Fig. 6.
Focus on A/B mosaic structure of chromosome 9 in the studied cultivated banana accessions. Coverage ratios for alleles specific to the A genome (green dots) and to the B genome (red dots) are plotted along the 11 pseudochromosomes of the Musa acuminata reference genome. Vertical dash lines indicate interspecific recombination breakpoints. The scale is indicated (in Mb) at the bottom of each figure.

