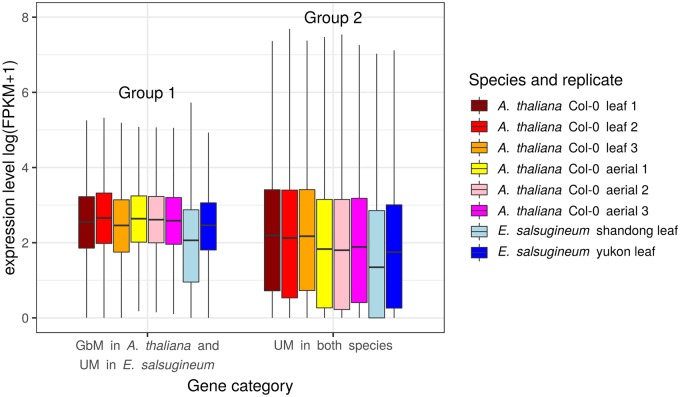
Fig 1.
Expression levels (log scale) for Arabidospis thaliana and Eutrema salsugineum in two gene Groups defined in table 1. The boxplot shows the median, the hinges are the first and third quartiles (the 25th and 75th percentiles) and the whiskers extend from the hinge to the largest or smallest value no further than 1.5 times the interquartile range (distance between the first and third quartiles).

