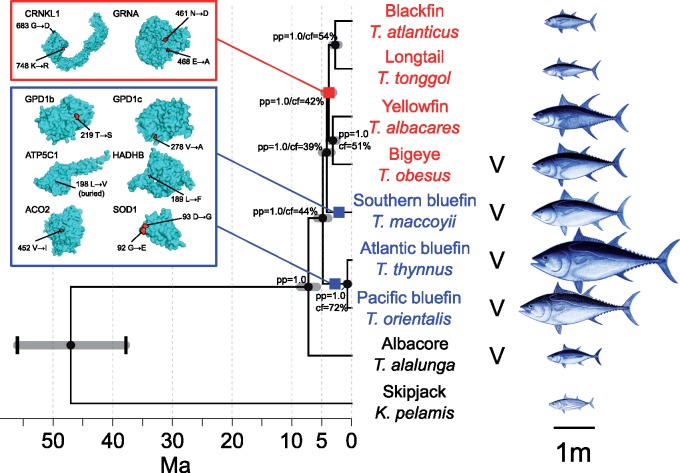
Fig. 1.
Fossil-dated phylogeny of tunas and parallel selection in bluefin species. 3D surface protein structures for genes with shared nonsynonymous mutations in bluefin tunas and a function relating to aerobic metabolism are given in the blue box, with the two branches where parallel selection on these variants occurred highlighted with blue squares, with bluefin species highlighted in blue. 3D protein structures inferred for genes under lineage-specific selection in the warm-water group are given in the red box. The branch these changes correspond to is indicated with a red square, with warm-water species highlighted in red. Species with visceral endothermy are indicated with a “V.” Amino acid changes and positions on the zebrafish reference genome (see table 1) are given, and their location on each protein model is highlighted in red. Species illustrations are from the FAO and wikimedia, rescaled according to the maximum length of each species, taken from Juan-Jordá et al. (2013). Gray error bars show 95% confidence intervals of divergence-date estimates. Black brackets on root node indicate minimum and maximum fossil calibration. Node labels are Bayesian posterior probability (pp), followed by concordance factors (cf) for the primary quartet inferred by ASTRAL; values lower that 100% indicate increasing gene-tree discordance, which in this case are within expectation from ILS.

