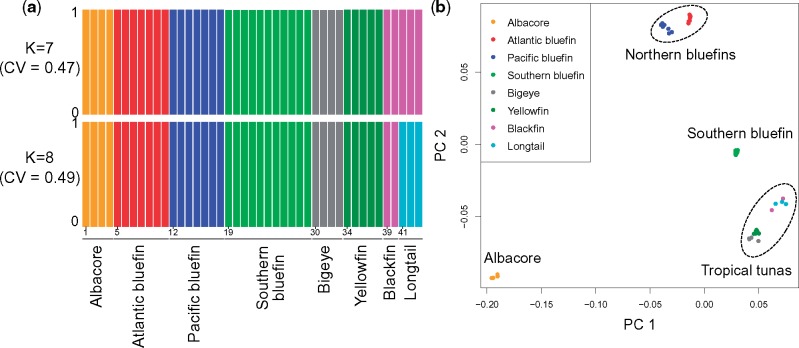
Fig. 2.
Genetic structure in tuna. (a) ADMIXTURE plot showing the estimated membership coefficients for each individual (labeled from 1 to 43 at the start of each species group), in each cluster. Each individual is represented by a single vertical bar, which is partitioned into K colored segments. Here the best scoring values were K = 7 (top figure), and then K = 8 (where all individuals cluster per species, lower plot), according to ADMIXTURE CV. (b) MDS for independent SNPs across the Thunnus phylogenetic tree, highlighting four groups. These analyses found no evidence of admixture between species (see text for details).

