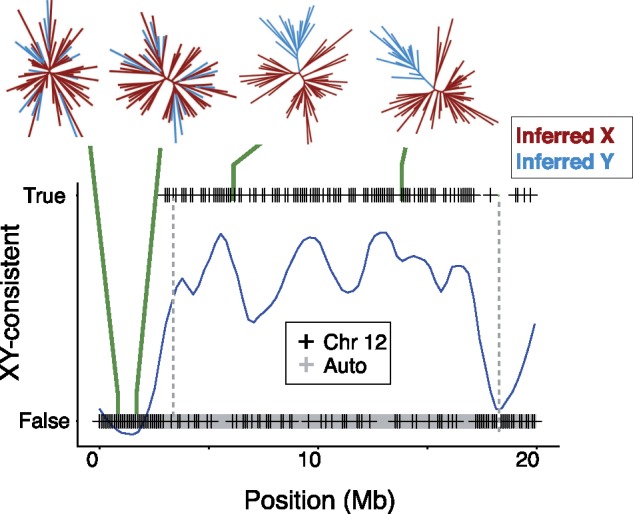
Fig. 2.

The incidence of XY-consistent topologies on Chr 12 and the autosomes in 100-kb windows in Pungitius pungitius. Blue curve traces the loess regression for Chr 12. Vertical dashed lines show the inversion breakpoints. Examples are shown of two gene trees from the PAR that do not have XY-consistent topologies, and two gene trees from the SDR that do. No autosomal gene tree showed an XY-consistent topology. Positions on the X axis refer to Chr 12, and autosomes have been rescaled to the same length.
