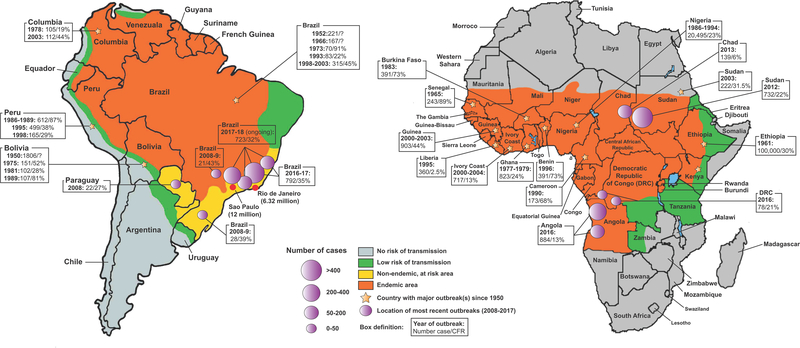
Figure 1. YFV endemic areas and epidemiological distribution of YF outbreaks since 1950.
YFV endemic areas (orange) in South America (left) and Africa (right) are shown. Non-endemic, at risk areas (yellow), areas with low risk of transmission (green) and no risk of transmission (grey) are also displayed. On each continent, countries where major YF outbreaks occurred between 1950 and 2018 are marked by a yellow star, and epidemiological information (number of cases/CFR) for some of these outbreaks are shown. Precise locations of the most recent YF outbreaks (2008–2018) are represented by purple circles, sized in proportion to the intensity of the reported outbreak. Data were extracted from the WHO Global Yellow Fever Data Base (i) and from the periodic WHO “Yellow Fever Situation Reports” (viii). Epidemiological information related to the ongoing 2017–2018 outbreak in Brazil shows the number of confirmed cases and related CFRs reported between July 1, 2017 and February 27, 2018 (vi).

