Fig. 3.

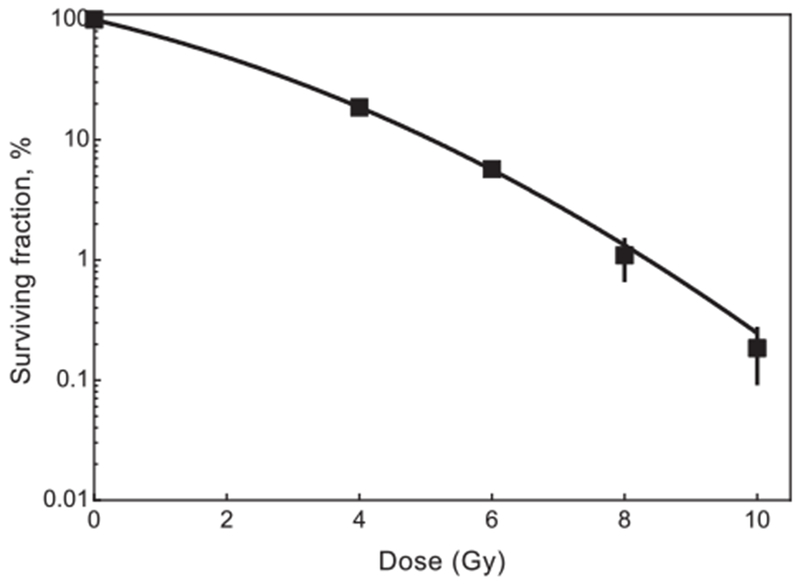
Dose response curve for HFF1 after irradiation with X-ray up to 10 Gy. Error bars represent the standard error of mean and each data point represents at least 4 independent experiments.

Dose response curve for HFF1 after irradiation with X-ray up to 10 Gy. Error bars represent the standard error of mean and each data point represents at least 4 independent experiments.