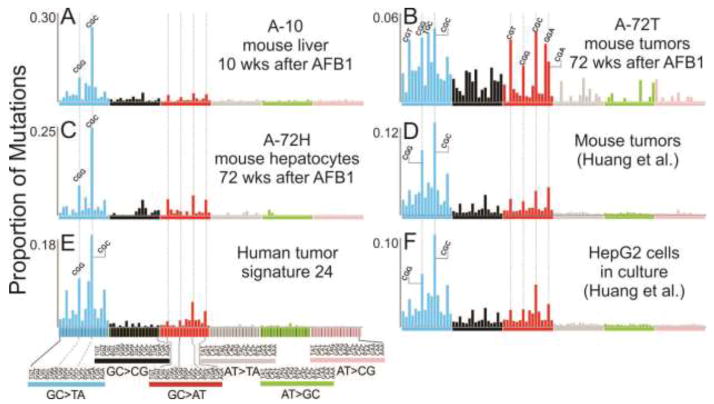
Fig. 3. Mutational spectra of aflatoxin B1.
Spectra shown in panels A, B and C are from Chawanthayatham et al., 2017, where a single dose of AFB1 was given to male mice in the first week of life. At 10 weeks, the mutations in their livers were enumerated using duplex consensus sequencing (spectrum A-10). At 72 weeks, the tumor cells were separated from the surrounding liver hepatocytes and analyzed separately, yielding spectra A-72T (tumor) and A-72H (hepatocyte fraction). Spectra shown in panels D and F were derived from Huang et al. 2017. Male mice exposed early in life to a single AFB1 dose were raised until tumors developed, which were then analyzed using whole genome sequencing (Panel D). HepG2 cells were exposed to AFB1 in cell culture, and then subjected to Whole Genome Sequencing (Panel F). Panel E shows human signature 24, as reported by Schulze et al. 2015, and on the COSMIC website. The x axis denotes triplet contexts for point mutations from the standpoint of purine-originated mutations; the order of triplets, however, is the same as the one shown in other published studies reporting mutational signatures. All spectra were normalized to reflect point mutation frequencies when trinucleotide oligomers occur with equal probabilities.

