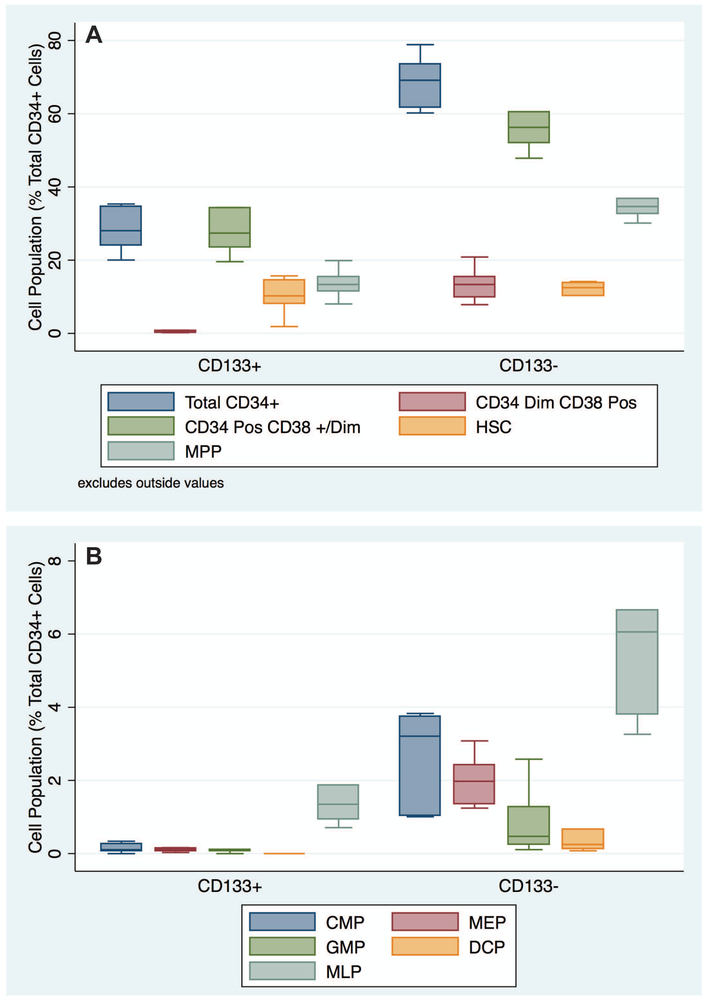
Figure 2: Quantity of Circulating Hematopoietic Progenitors in CD133− and CD133+ Cell Populations:
Panels A and B are box plot illustrations of hematopoietic progenitor populations presented as a percentage of the total circulating CD34+ cells. The populations are grouped based on the presence or absence of CD133 expression to compare their relative abundance in the total CD34+ pool. The horizontal bars in the boxes indicate the median values, and the boundaries of the boxes indicate 25th and 75th percentile ranges. Data from six healthy adult human subjects are presented.

