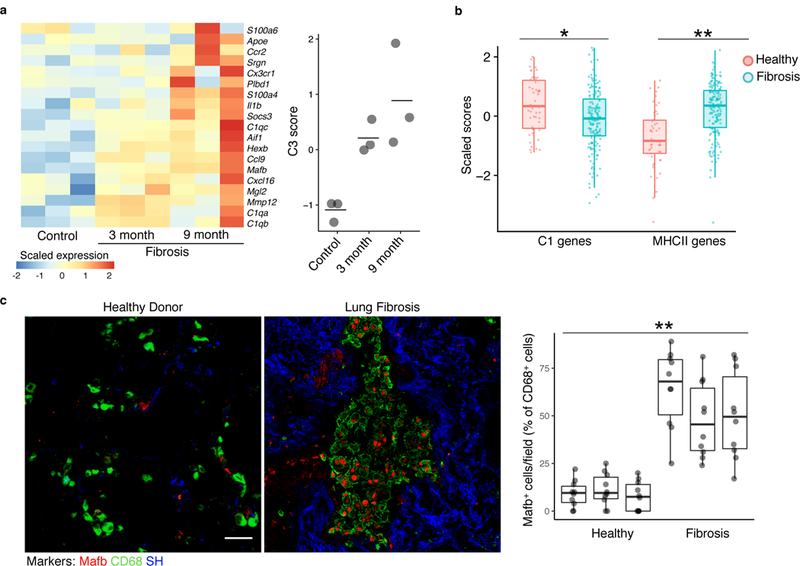
Figure 4. Markers of macrophages identified by scRNA-seq are found in multiple fibrosis models.

a, Heatmap of C3 genes from bleomycin-induced fibrosis measured by microarray in an epithelial telomere dysfunction model of progressive lung fibrosis (n=3 biologically independent mice in each condition, center value is mean). b, Gene set enrichment analysis scores of human orthologues of cluster C1 genes and of MHCII genes in bulk RNA-seq samples from patient lung biopsy specimens32. Points indicate individual microarray samples from n=167 and n=50 patients and controls, respectively. c, Immunofluorescence of human fibrotic and healthy control lung (representative images are shown; quantitation is for n=3 independent fibrotic patient lung and n=3 independent healthy lung samples, 10 images per sample). Scale bar, 50 μm. SH=second harmonic imaging of collagen. Box plot center line is median, box limits are upper and lower quartiles, and whiskers denote the largest and smallest values no more than 1.5 times the interquartile range from the limits. Wilcoxon test 2-tailed p-values are presented. * p<0.01, ** p<0.0001.
