
Figure 7. Cx3cr1-derived macrophages drive fibroblast accumulation and fibrosis after lung injury.
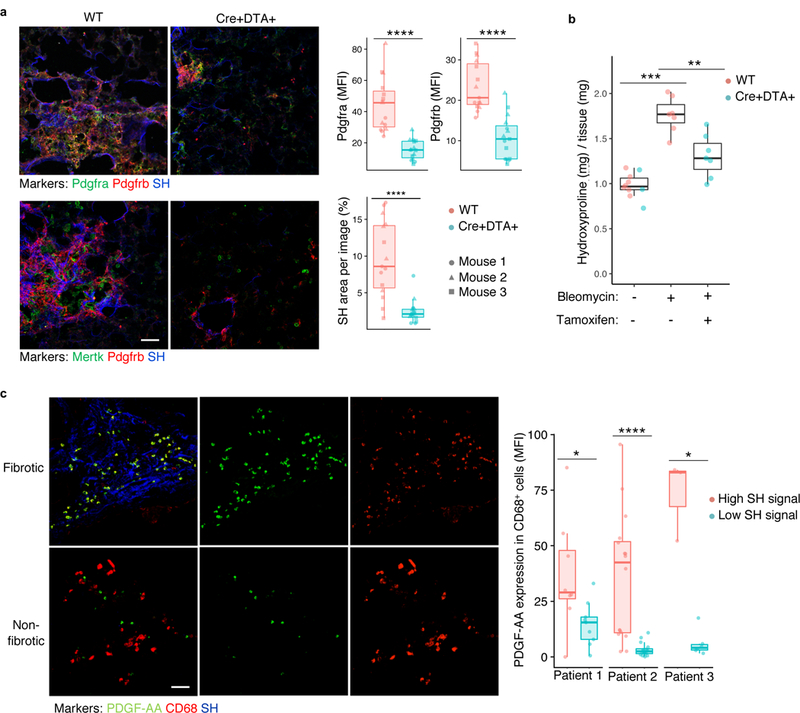
a, Lung immunofluorescence of fibroblast and macrophage markers 21 days after bleomycin injury in Cx3cr1-CreERT2 / Rosa26-loxp-STOP-loxp-Diphtheria Toxin A and wild-type mice (quantitation is for n=3 biologically independent mice per group, 5 images per mouse). b, Fibrosis measured by hydroxyproline assay for lung collagen content in mice treated as in a (blue points are Cx3cr1-CreERT2 / Rosa26loxpSTOPloxp-Diptheria Toxin A mice and red points are wild type; n=10, n=7, and n=7 biologically independent mice per group from left to right). Scale bar, 50 μm. c, Immunofluorescence of fibrotic (high SH) and non-fibrotic (low SH) regions from explanted human fibrotic lung, with quantification of individual images from 3 separate patients (8 high and 9 low regions in patient 1, 16 high and 16 low in patient 2, and 3 high and 6 low in patient 3). SH=second harmonic signal for collagen. Scale bar, 50 μm. Box plot center lines are median, box limits are upper and lower quartiles, and whiskers denote the largest and smallest values no more than 1.5 times the interquartile range from the limits. Wilcoxon test 2-sided p-values are presented. * p < 0.05; ** p < 0.01; *** p < 0.001; **** p < 0.0001.