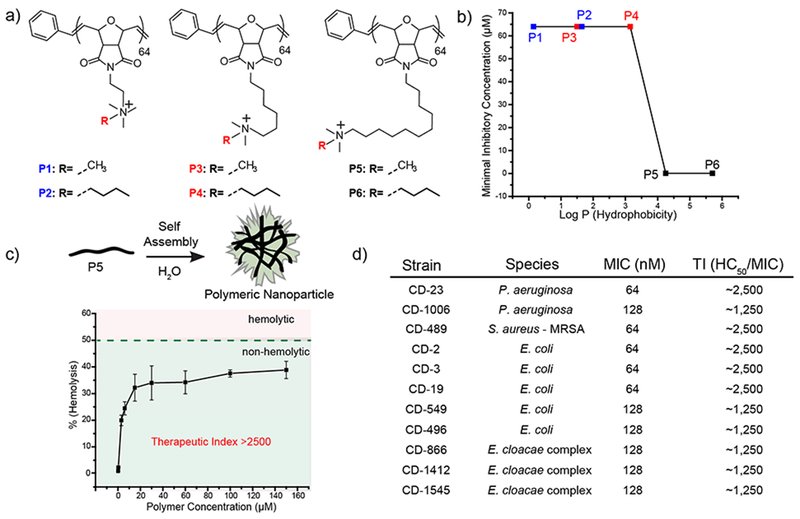
Figure 6.

a) Molecular structures of the polymers used in the study. b) Minimal inhibitory Concentrations (MICs) of polymer derivatives plotted against Log P. Log P represents calculated hydrophobicity of each monomer. c) schematic showing self-assembly of polymers and graph showing hemolytic activity against red blood cells. d) Table showing MIC and therapeutic indices of P5 PNPs against clinical isolates. Reproduced from reference 32 with permission from American Chemical Society, Copyright © 2018.
