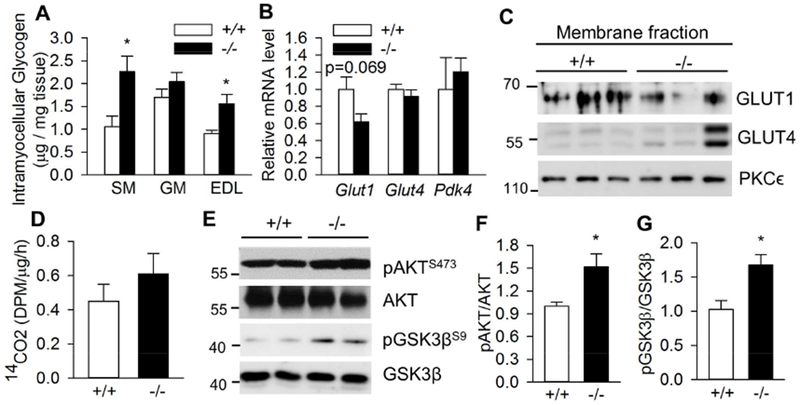
Fig. 2. Differential glycogen deposition in skeletal muscles of fed Bscl2−/− mice.

(A) Intramyocellular glycogen content as normalized to tissue weight in soleus muscle (SM), gastrocnemius muscle (GM) and extensor digitorum longus muscle (EDL), n=8/group. (B) RT-PCR analysis of genes involved in glucose transport and metabolism in SM, n=6/group. (C) Targeting of GLUT1 and GLUT4 to membrane in SM. PKCϵ was used as loading control. n=3/group. (D) Glucose oxidation assay by measuring CO2 production after incubating SM crude mitochondrial fraction with 14C-glucose, n=4/group. (E) Phosphorylation of AKT at Ser473 and GSK3β at Ser9 in SM; (F) pAKT/AKT ratio; (G) pGSK3β/GSK3β ratio, n=5/group. All experiments were performed in 13 week old male Bscl2+/+ (+/+) and Bscl2−/− (−/−) mice under fed states. *: p< 0.05.
