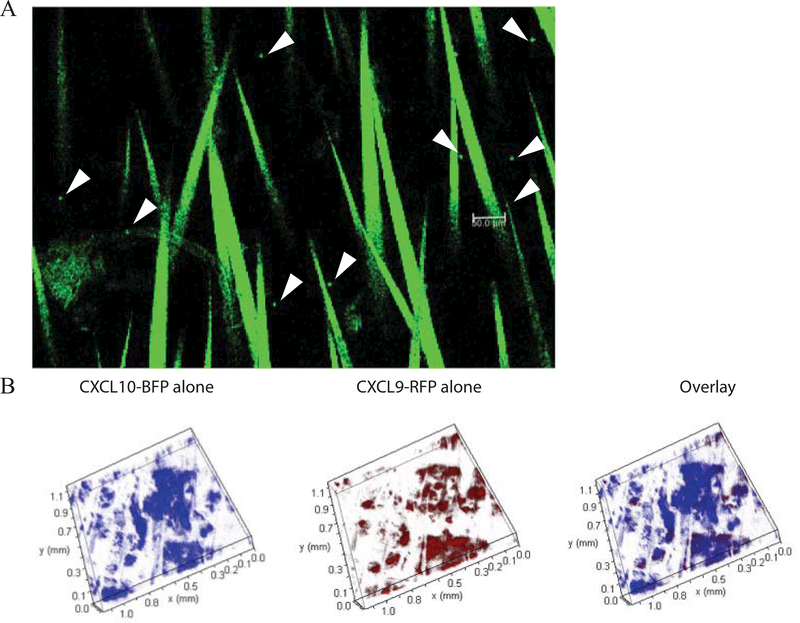
Figure 9:
Visualization of Pmel-1 and chemokine expression in the skin by confocal imaging. A) Sample image from a vitiligo mouse at week 7 depicting GFP+ Pmel-1 CD8+ T cells in the tail skin. Pmel-1 are rounded punctate cells (arrows). Bar = 50 μm. Hairs are visible due to autofluorescence. B) Tail skin of REX3 SCF vitiligo mouse showing clouds of CXCL10-BFP and CXCL9-RFP chemokine expression (10× z-stack).

