
Fig. 2. Interpretation of patterns of tracts with encounters with an ICL.
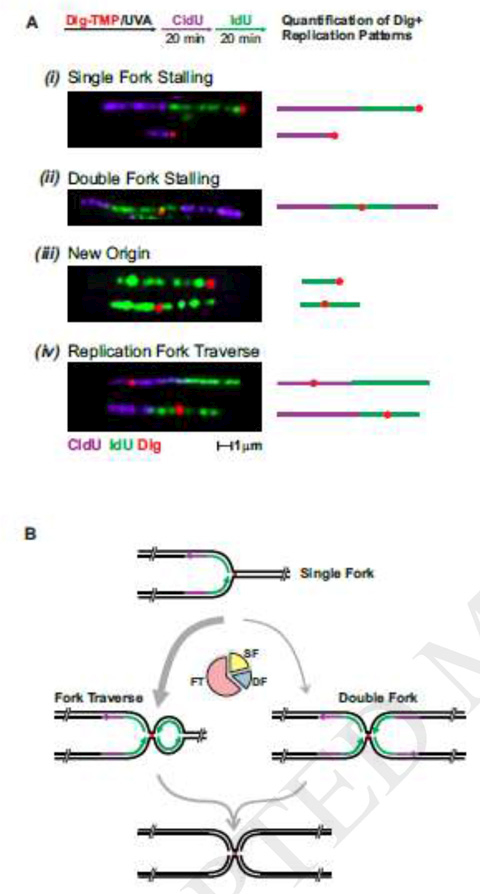
A. Experimental scheme and representative images of the patterns observed. The replication restart pattern is termed fork traverse.
B. Scheme summarizing the possible outcomes observed when the replication fork encounters a Dig-TMP/UVA induced ICL. The pie chart shows the relative frequency of the major patterns in wt cells. FT, replication fork traverse, SF, single fork, DF, double fork.