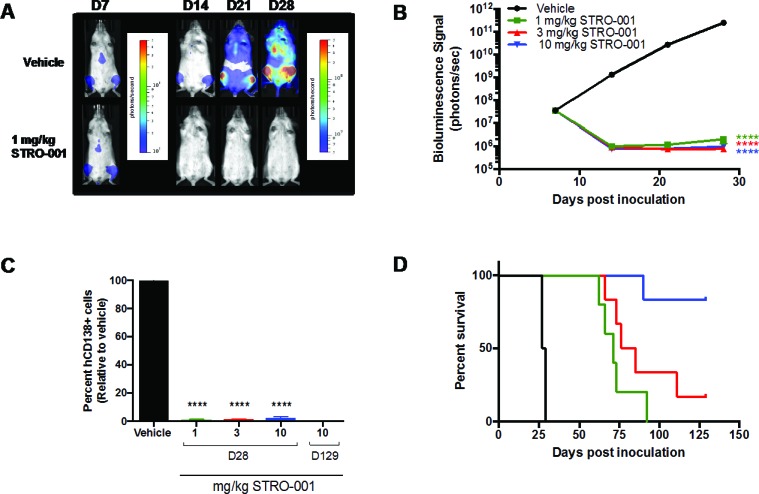
Figure 8. Antitumor activity of STRO-001 on MM.1s model assessed with bioluminescence imaging.
NSG mice inoculated with MM.1S-luc cells received a single dose of vehicle, 1, 3, or 10 mg/kg STRO-001 at 7 days post-inoculation. (A) Representative series of in vivo bioluminescence images showing MM.1S-luc cells in the bone marrow of live mice treated with vehicle or 1 mg/kg STRO-001 at different time points. Different color bar scales were used for day 7 (1 × 10⁵ to 5 × 10⁶) and days 14, 21 and 28 (5 × 10⁶ to 5 × 10⁸). Similar response was observed with 3 and 10 mg/kg STRO-001 (data not shown). (B) Quantification of bioluminescence in live mice treated with vehicle, 1 mg/kg STRO-001, 3 mg/kg STRO-001 and 10 mg/kg STRO-001. (C) Quantification of hCD138+ cells in the bone marrow depicted as percent relative to vehicle control (set as 100% maximum) on days 28 and 129. (D) Kaplan–Meier survival curves in response to treatment. Graphs are shown as average values ± SEM.

