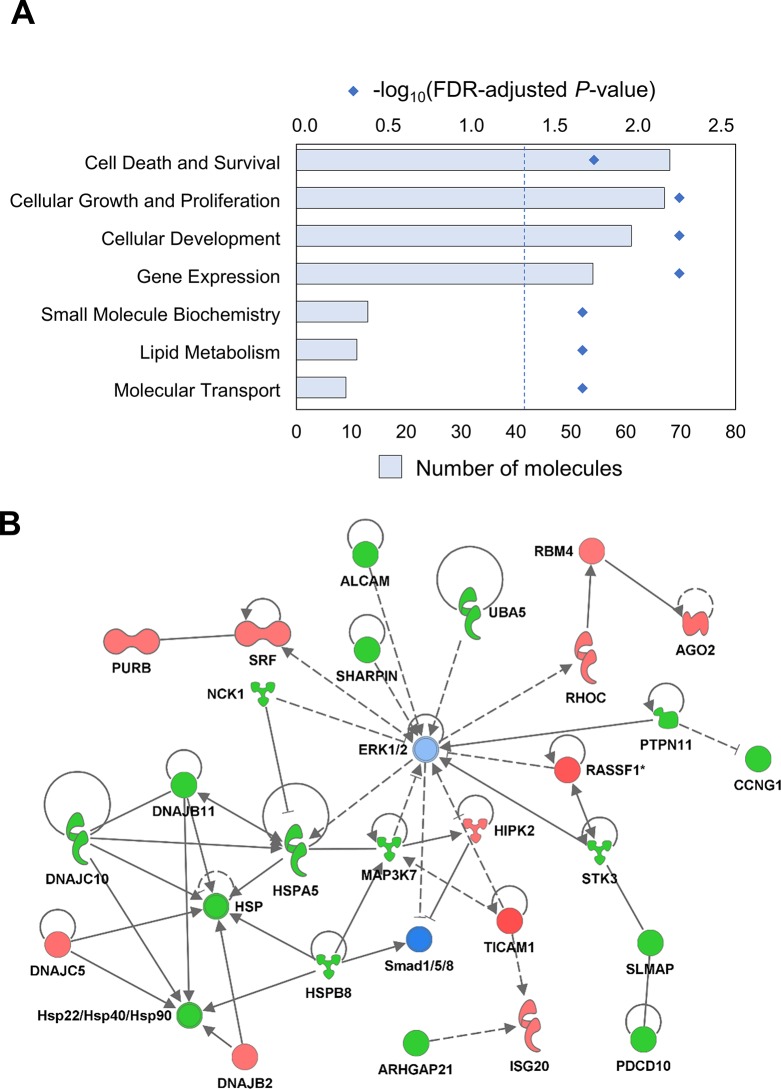
Figure 3. piR-8041 upregulation impacts expression of genes related to cellular survival, stress, and other glioma-relevant functions.
(A) List of biological functions statistically significantly enriched among genes differentially expressed by piR-8041 upregulation in U87 cells. Bars indicate the number of genes impacted with a particular functional annotation; diamonds denote the log-transformed FDR-adjusted P-values (dotted line indicates an FDR-adjusted P-value of 0.05). (B) Illustration of top network of differentially expressed transcripts, related to “decreased cell viability of connective tissue cells” and “decreased synthesis of protein” following piR-8041 treatment of U87 cells. Red and green shading denote transcript over- and under-expression relative to negative control after piR-8041 upregulation, respectively, with color intensity corresponding to degree of change, and blue shading denotes predicted signaling pathway inhibition. Solid lines and dotted lines indicate direct and indirect relationships, respectively.

