Figure 1.

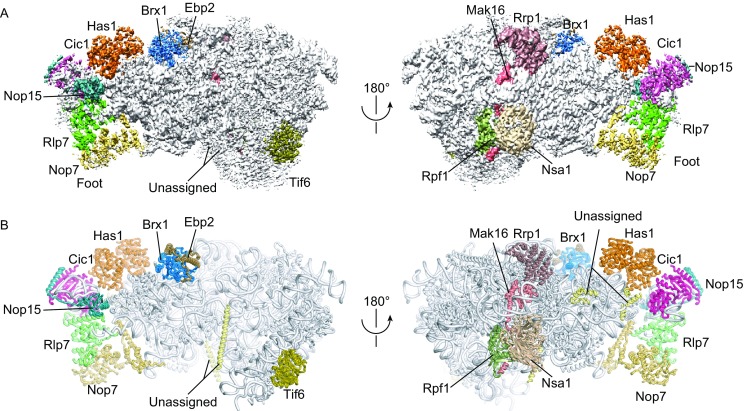
Cryo-EM structure of Rpf1-TAP pre-60S. (A) Cryo-EM density map in two opposite views. The densities for AFs are color coded. (B) Structural model in the same views as (A). The rRNAs and RPLs are colored grey and the AFs are color coded

Cryo-EM structure of Rpf1-TAP pre-60S. (A) Cryo-EM density map in two opposite views. The densities for AFs are color coded. (B) Structural model in the same views as (A). The rRNAs and RPLs are colored grey and the AFs are color coded