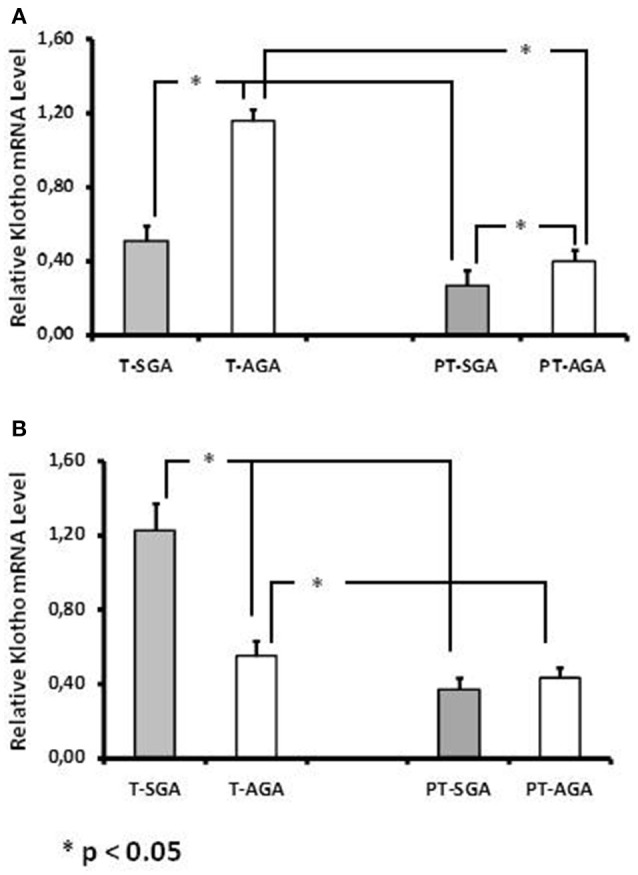
Figure 1.

Klotho mRNA expression in placentas from chorionic plate (A) and basal plate (B) of term [T-SGA (n = 37) and T-AGA (n = 32)] and preterm [PT-SGA (m = 20) and PT-AGA (n = 28)] pregnancies. The values represent the mean 2ΔΔCt ± SEM for each group. The gene amplifications in each placenta were performed by triplicates.*p < 0.05.
