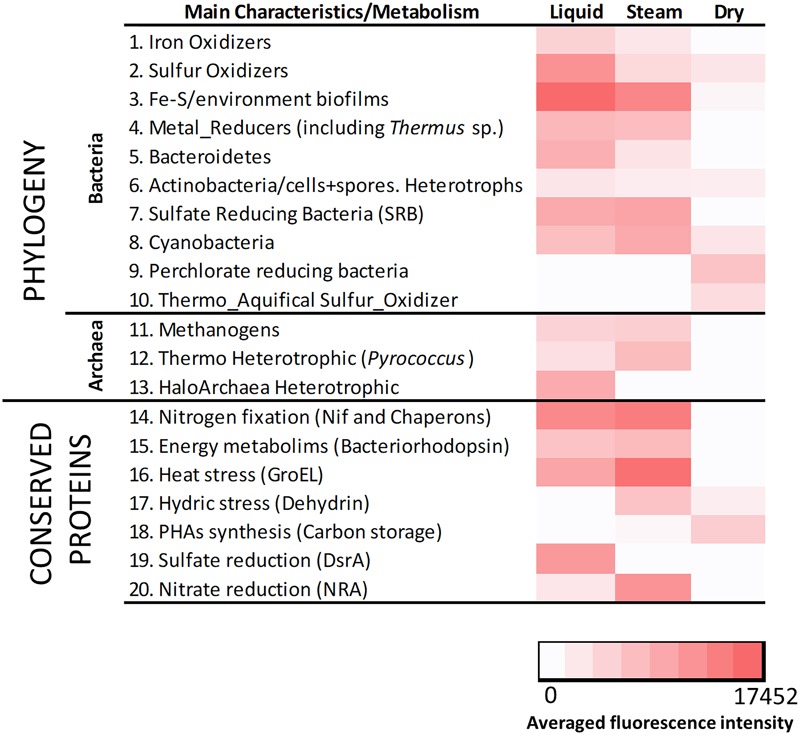
FIGURE 7.

Heat map showing the results obtained with LDChip200 immunoassays. The antibodies (see Supplementary Table S3) were reorganized on the basis of main phylogenetic groups and metabolic traits of the target immunogens and protein functions in 19 different categories. The averaged fluorescence intensity of those positive immuno-detections within the same category (Supplementary Figure S9), obtained from three replicates per sample (that means nine spots per antibody), is plotted in a color scale from white (negative results) to red (maximum of 17452). Please note that 0 stands for those values under the limit of detection.
