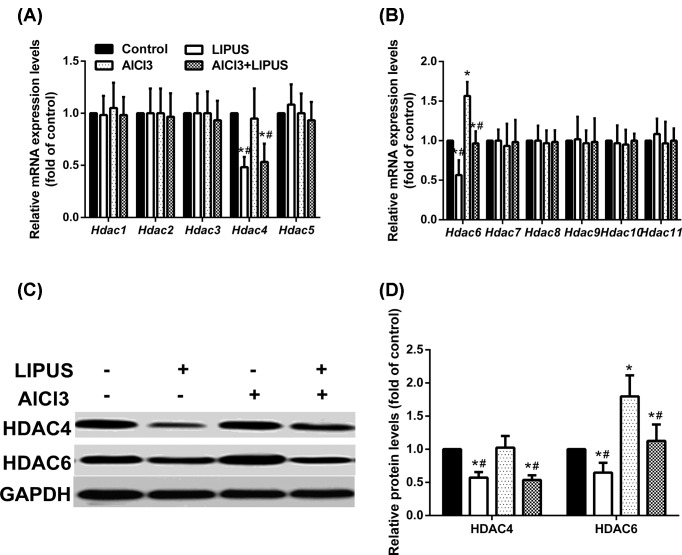
Figure 3. Effects of LIPUS and AlCl3 treatment on the expression of HDAC in the rat hippocampus.
HDAC mRNA levels were measured by qPCR (A,B), HDAC4 and HDAC6 protein levels were measured by Western blot analyses (C,D). Results were shown as mean ± s.d. (n = 6). *P < 0.05 vs control group, #P < 0.05 vs AlCl3 group.

