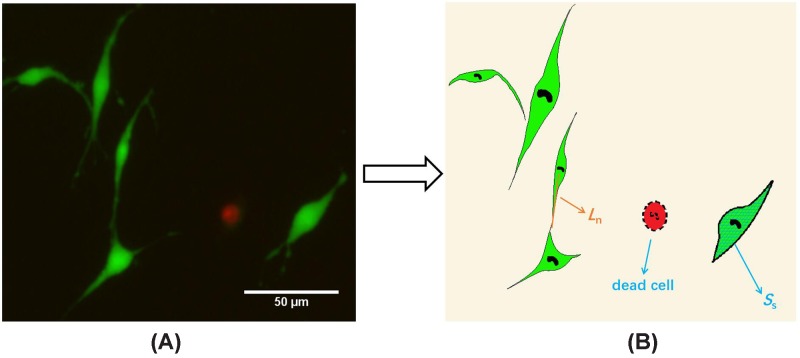
Figure 3. Definitaion the outgrowth characteristics and morphology of PC12 cells.
(A) Live-dead staining of live cells (green) and dead cells (red) in PC12 after 3 days of culture on 10% GelMA substrate. (B) The distance from the center of the cell to the end of the neurite (the orange line) represents length of neurite (Ln). The area of cell contour (the blue grid) represents spreading area (Ss).

