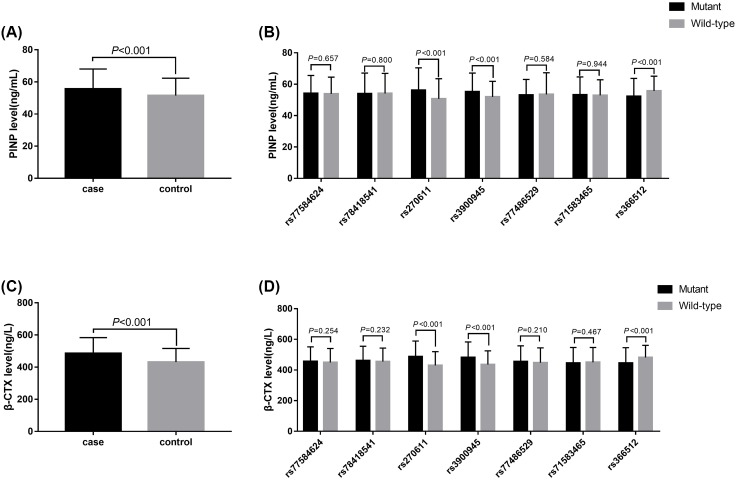
Figure 2. The measurements of serum PINP and β-CTx levels.
(A) Serum PINP levels of the case and control group. (B) Plasma levels of serum PINP with the allelic distribution of PDLIM4 gene variants. (C) Serum β-CTx levels of the case and control groups. (D) Plasma levels of serum β-CTx with the allelic distribution of PDLIM4 gene variants.

