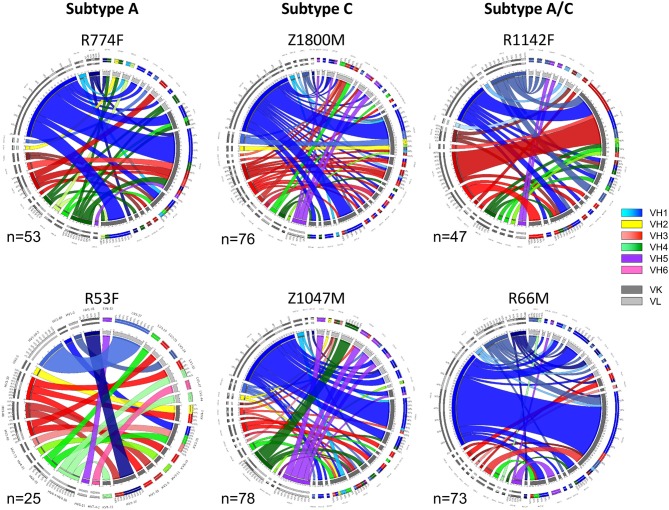
Figure 2.
Circos diagrams of VH and VL pairing networks at 7.5-months post-infection (time point 2). Germline genes were assigned to each VH and VL sequence from each gp120-reactive single B cell using NCBI IGBLAST and vquest analysis. Circos diagrams were utilized to illustrate the network of VH germline (shades of blue VH-1, yellow VH-2, shades of red VH-3, shades of green VH-4, purple VH-5, pink VH-6) with the paired VL κ (dark gray) or λ (light gray) germline from individuals infected by HIV-1 Subtype A (left column), Subtype C (center column), and Subtype A/C unique recombinants (right column). Band width is proportional to the number of paired sequences that contain those VH and VL pairs. The total number of paired sequences analyzed for each individual is shown.

