
Figure 2.
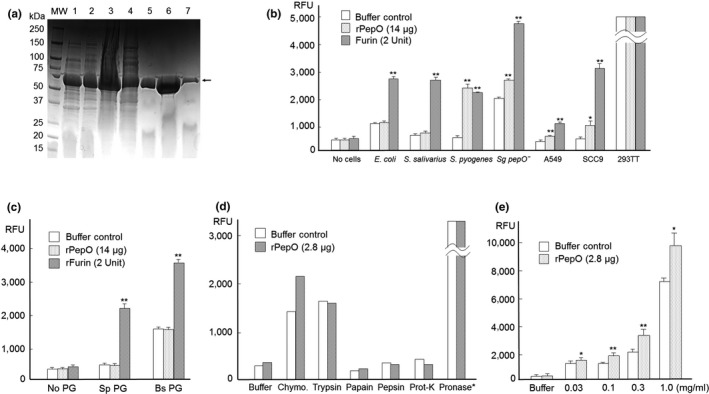
(a) Affinity purification of recombinant S. gordonii PepO from E. coli shown in SDS–PAGE. 1) Pellet without IPTG; 2) Pellet with IPTG for 6 hr; 3) Crude lysate; 4) Elution fraction 2 (flow through); 5) Fraction 8; 6) Fraction 9; and 7) Fraction 10. Arrow: rPepO. (b) rPepO activation by bacteria (E. coli JM109, S. salivarius 101‐1, S. pyogenes NS05‐24, and S. gordonii pepO mutant) and mammalian cells (A549, SCC9 and 293TT). Buffer controls are buffer with indicated cells. 293TT cells released about 19,000 RFU fluorescence from the furin substrate with or without added rPepO and furin, showing high endogenous furin level. (c) rPepO activation by bacterial peptidoglycan (PG). Sp. S. pyogenes; Bs, B. subtilis. Buffer controls are buffer with indicated PG. Note: B. subtilis PG in buffer displayed high furin‐like protease activity, indicating that these PGs may contain proteases. (d) rPepO activation by chymotrypsin, trypsin, papain, pepsin, and proteinase K. Pronase (protease from Streptomyces griseus) (Calbiochem) released 12,000 RFU fluorescence from the furin substrate with or without added rPepO (one measure per sample). Buffer controls are buffer with indicated protease. (e) rPepO activation by chymotrypsin. Both buffer control and rPepO samples contain chymotrypsin with indicated amount in the figure. *Significant difference (p < .05); **very significant difference (p < .01) compared with controls