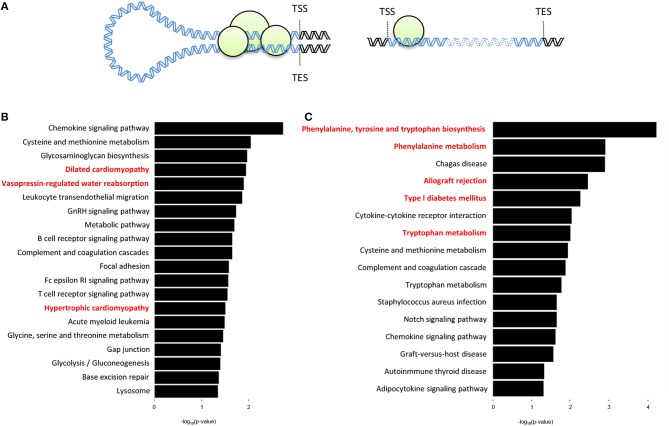
Figure 4.
Genes with promoter-TES loops tend to have organ-specific functions within the cell. (A) Illustration depicting a gene with promoter-TES interactions (left) and a gene with no promoter-TES interactions (right). (B) KEGG pathway analysis of the genes with significant (q < 0.01) Fit-Hi-C interactions between promoters and transcription end sites in the cardiac Hi-C data. Cardiac-related terms are highlighted in red. (C) KEGG pathway analysis for genes with significant promoter-TES Fit-Hi-C interactions in liver Hi-C data. Liver-related terms are highlighted in red. For panels (B,C), p-values are calculated using a hypergeometric test.

