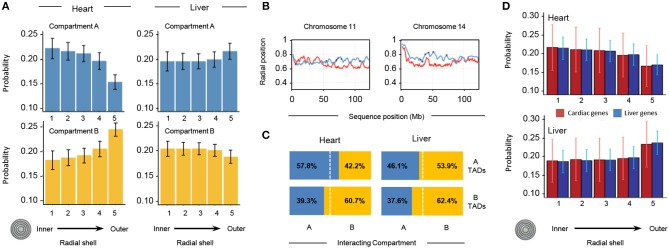
Figure 8.
Properties of 3D models of heart and liver genomes. (A) The nucleus is divided into 5 concentric shells, with shell 1 in the interior and shell 5 at the periphery. In heart nuclei (left), TADs in compartment A are more likely to be found toward the interior of the nucleus and TADs in compartment B toward the periphery. In contrast, the liver Hi-C data (right) show that TADs in compartment A have a higher probability of being found toward the periphery and those in compartment B within one of the inner shells. Error bars indicate standard deviation of observations for 10,000 structures. (B) Across distinct regions of chr11 (left) and chr14 (right), radial positions of TADs between organs (heart in red, liver in blue) differ. Positions of heart- (red dots) and liver-specific genes (blue dots) superimposed. The y-axis shows average position (0 is the center of the nucleus, 1 indicates nuclear periphery), while the x-axis shows chromosome position in megabases. (C) In 3D cardiac nuclear models (left), on average 57.8% of queried A-compartment TADs form interchromosomal interactions (within 500 nm) with regions in compartment A, while 60.7% of queried B-compartment TADs form interchromosomal interactions with regions in compartment B. Contrastingly, liver models show that 53.9% of queried A-compartment TADs are within 500 nm of regions in compartment B, while 62.4% of queried B-compartment TADs interact with the same compartment in a different chromosome. (D) Similar analysis as in (A), but with TADs that have heart- (red bars) or liver-specific (blue bars) genes. In cardiac nuclei (left), both heart- and liver-specific genes tend to associate with the nuclear center, while in liver nuclei the trend is the opposite. Error bars indicate standard deviation of observations for 10,000 structures.

