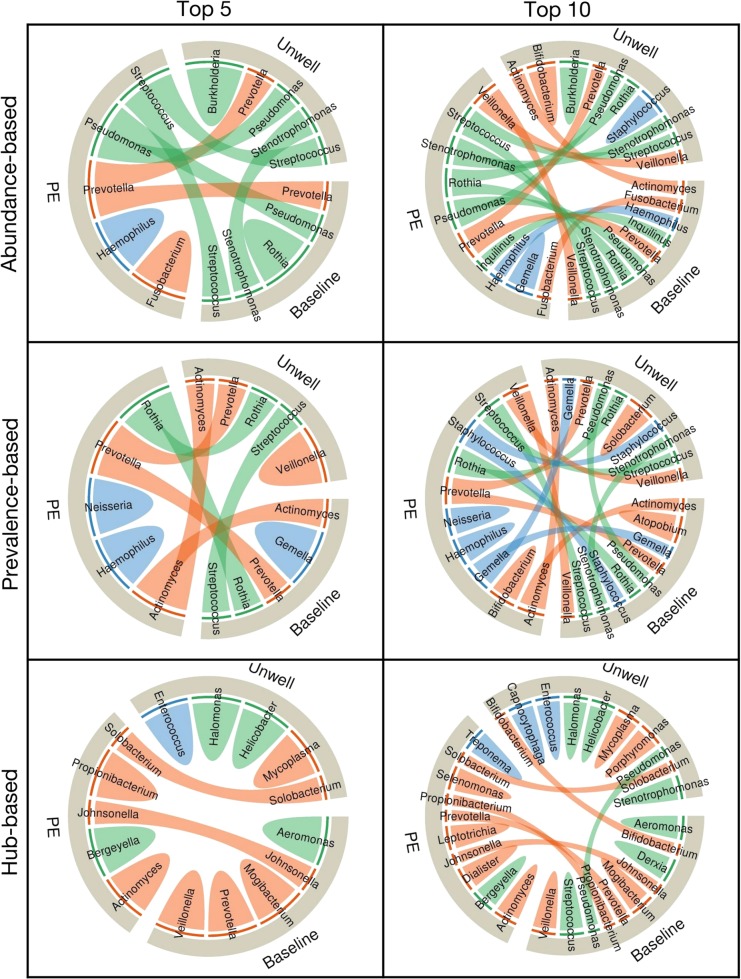
Fig. 3.
Associations between key taxa of CF lung microbiome and different clinical states in the cross-sectional analysis for both the top five and top ten key taxa. The chord diagrams show the key taxa identified by the three different strategies (e.g., abundance-, prevalence-, or hub-based). The outer ribbon identifies the respective clinical states and encompasses the set of key taxa identified to be associated with each state. Taxa that are associated with more than one state are connected by chords in the inner circle. Taxa and their respective chords are colored based on their primary mode of metabolism, with orange, blue, and green representing anaerobic, facultative anaerobic, and aerobic taxa, respectively. Fewer interactions (i.e. chords) between clinical states demonstrate the higher level of stratification of key taxa based on patients’ health, i.e., the power of each strategy to delineate key taxa based on patients’ clinical states

