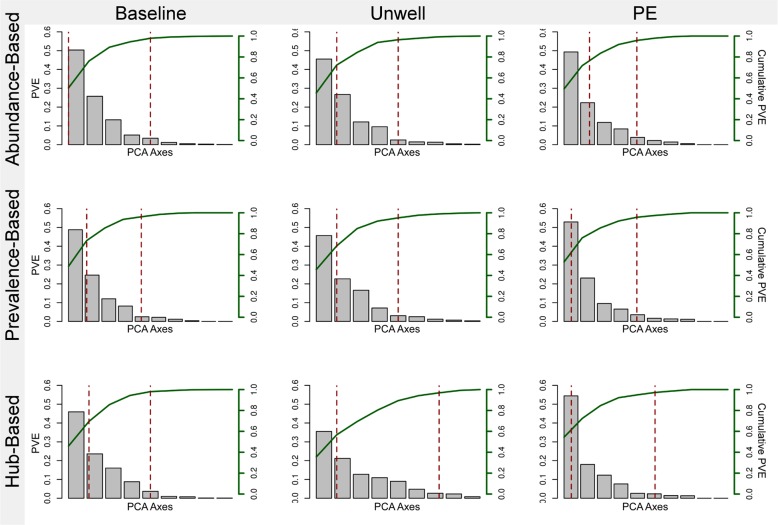
Fig. 4.
Principle coordinates analysis (PCoA) scree plots based on the diversity of key taxa identified by the three strategies (abundance-, prevalence-, and hub-based) for each clinical state (i.e. baseline, unwell, and pulmonary exacerbations). Each PCoA axis is plotted against the total percent variance explained (PVE) on the left y-axis, while the cumulative percent variance explained is plotted in green on the right y-axis. The two dashed lines in each plot correspond to the 50% and 90% cumulative PVE

