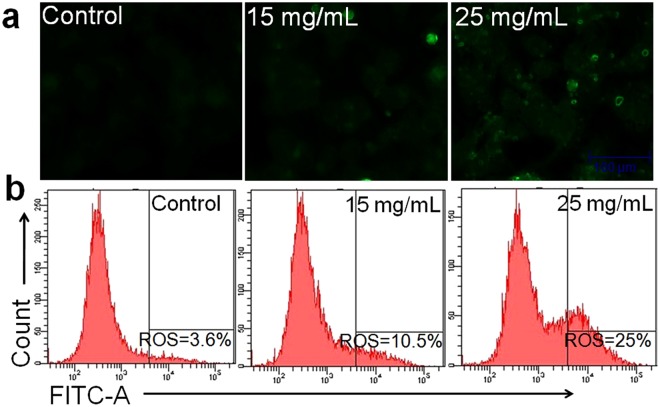
Figure 5.
Intracellular ROS generation in human HCC cells induced by different concentrations of ADP extract (a) Photomicrographs showing intracellular ROS generation induced by two effective concentrations (15 and 25 mg/mL) of ADP extract after 12 h incubation. Photomicrographs were taken with a fluorescence microscope. Scale bar = 100 μm (b) The fluorescence in the cells is represented as the percentage of ROS production analyzed using flow cytometry.

