Fig. 3.
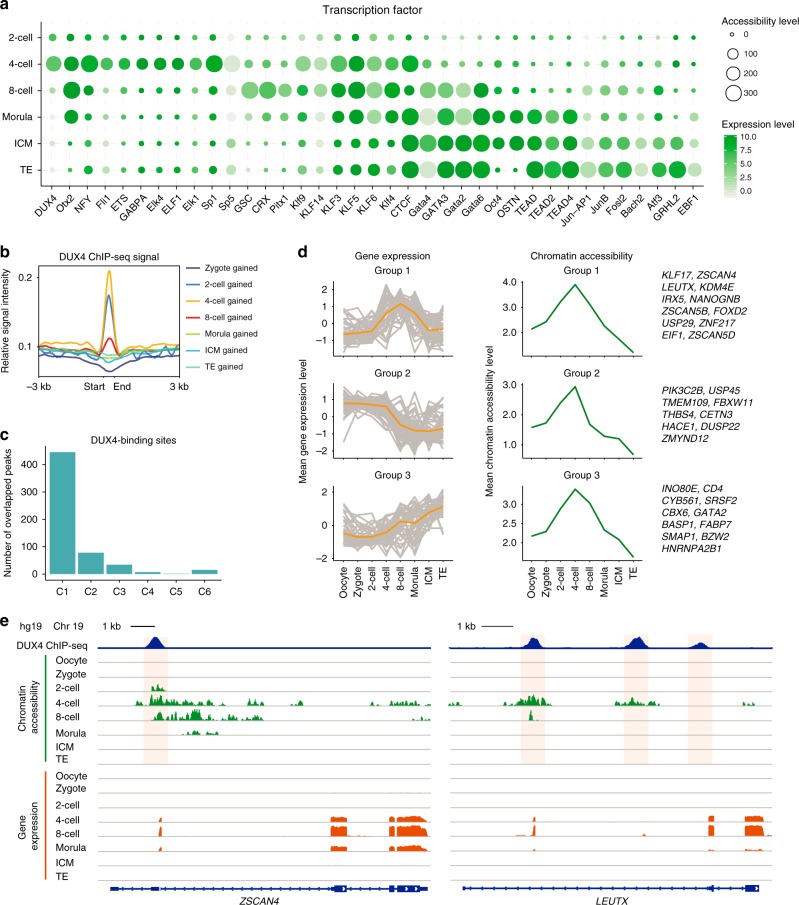
Identification of key transcription factors during human pre-implantation development. a Enrichment of TF motifs within the gained accessible regions at the indicated stages. Each point represents a significant enrichment for the indicated motifs. The point size represents the motif-enrichment P value (−log P value) and the color represents gene expression level of the corresponding TFs. OSTN represents OCT4-SOX2-TCF-NANOG, and the expression level for OSTN is the mean expression level of the four genes. b Enrichment of DUX4 ChIP-seq signals in accessible regions gained at each development stage. c Number of DUX4-binding sites that overlap with the accessible regions in the six chromatin accessibility clusters in Fig. 2a. d Left panel: fuzzy clustering analysis of DUX4 target gene expression level at the indicated stages. The individual gray lines represent the expression level of individual genes, and the orange line represents the value for the cluster center. Middle panel: dynamics of mean values of normalized chromatin accessibility signals for all regions corresponding to the genes analyzed in the left panel. The example genes are listed in the right panel. e Genome browser views showing DUX4 binding, chromatin accessibility, and gene expression signal around ZSCAN4 (left panel) and LEUTX (right panel). Source data used in this figure are provided as Supplementary Data 3

