Fig. 1.
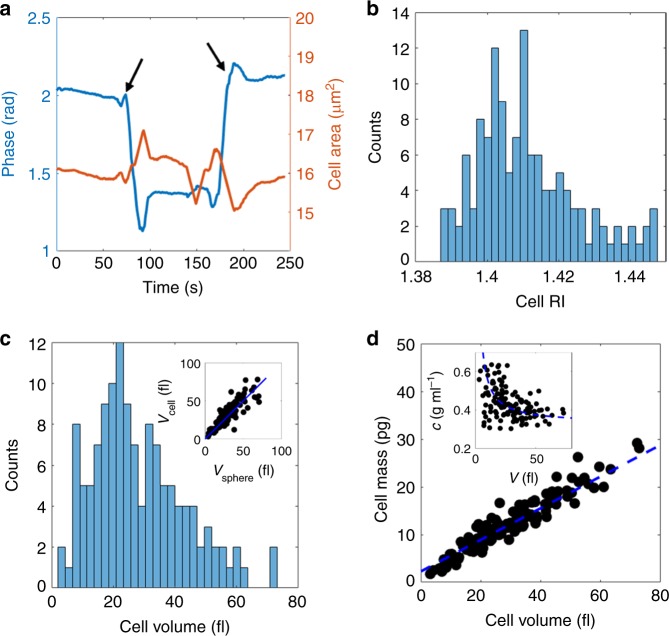
Determination of cell RI and volume. a The temporal response in the average phase shift () (blue curve) and area (red curve) upon exposure of a yeast cell to two iso-osmotic solutes with different RI. The arrows indicate the time points of solute exchange. b, c The measured cell RIs and volumes based on the equations discussed in the main text. Inset to c shows the measured cell volume versus the expected volume for spheres of equal cross section to the imaged cells. Cells falling above the blue line are slightly prolate, cells falling below are slightly oblate. d Cell dry mass is strongly correlated with cell volume. The mass is fitted to an expression mdry = ccytVcyt + cpVp, with Vcell = Vcyt + Vp, where Vcyt and Vp represent the osmotically active and osmotically non-responsive volumes, determined by studying the scaling of volume with external osmolarity as detailed in the text. Inset: The mass concentration is inversely related to cell volume. The blue dashed line corresponds to the same fit as in the main figure

