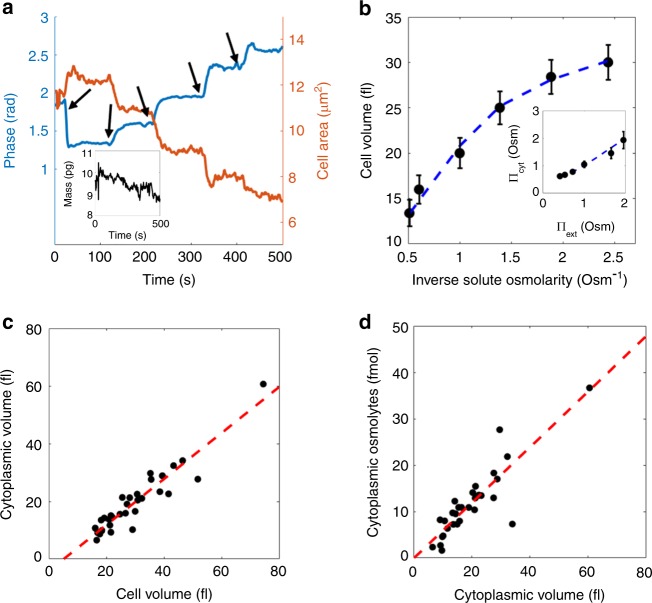
Fig. 2.
Response of yeast cells to brief (<10 min) osmotic shock. a Characteristic temporal response of phase shift and area A of a single cell during exposure to a series of solutes having identical RI but increasing osmolarity. The arrows indicate the time points of solute exchange. Inset shows the inferred cell mass, verifying that the observed changes in cell RI and volume are due to outflux of water only. b The volume of the cell analyzed in a as a function of inverse osmolarity. The dashed line shows a fit to the model described in the text. Error bars correspond to the uncertainty in the volume determination estimated in the main text. Inset: The cytosolic osmolarity as a function of external osmolarity. c The estimated cytoplasmic volume (related to the free water content) is linearly related to the cell volume (at external osmolarity Πext = 0.53 Osm). Small cells show smaller cytoplasmic volume (indicating less free water). d The number of intracellular osmolytes is directly proportional to cytoplasmic volume (at external osmolarity Πext = 0.53 Osm), suggesting a volume-independent cytoplasmic osmolarity

