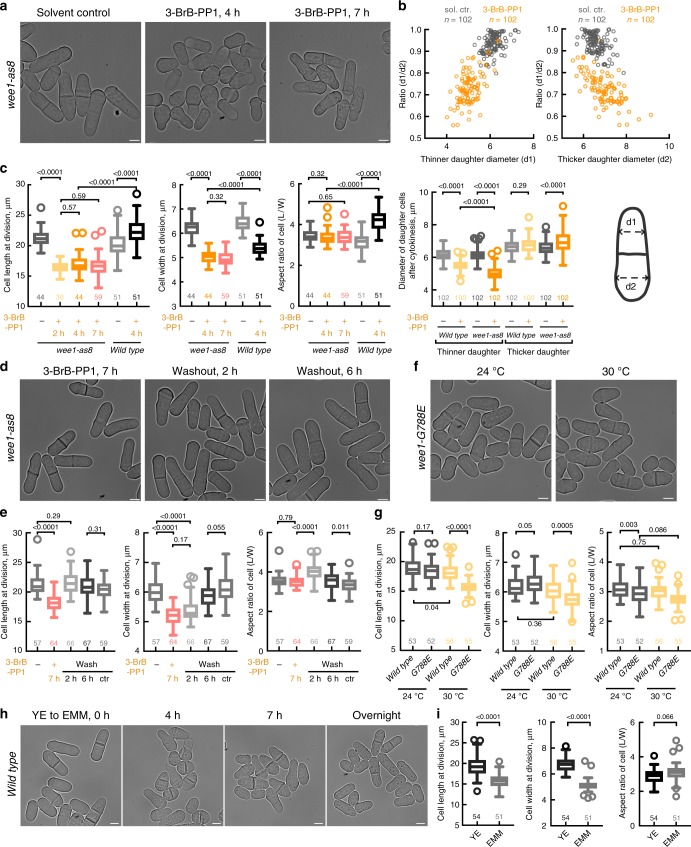
Fig. 1.
S. japonicus maintains cellular aspect ratio over a range of volumes. a S. japonicus analog-sensitive wee1-as8 cells incubated with methanol (solvent control) or 20 μM ATP analog 3-BrB-PP1. Note the morphological transition in 3-BrB-PP1-treated cells occurring at a 4-h time point. b Wee1 inhibition initially causes differences in the diameters of two daughter cells (orange circles indicate cells treated with 3-BrB-PP1 for 2 h; gray circles represent solvent control). Shown are scatter plots, where either “thinner” (top left) or “thicker” (top right) daughter cell diameter measurements are on x-axis, and the ratios between diameters of the daughters are on y-axis. Graph (bottom right) compares cell diameter changes of the two daughters between control and 3-BrB-PP1-treated wee1-as8 and wild type populations. c Quantifications of cell length, width and aspect ratio at division of wee1-as8 cells shown in (a) and similarly treated wild type cells shown in Supplementary Fig. 1c. d Wee1-inhibited cells recover their original dimensions following the removal of the ATP analog from the growth medium. Shown are wee1-as8 cells treated with 20 μM 3-BrB-PP1 for 7 h, following the washout of the drug for 2 and 6 h. e Quantifications of cell length, width and aspect ratio at division of cells shown in (d). Methanol-treated wee1-as8 cells washed with growth medium (5th column) were used to control for cell number increase and washing procedure. f wee1-G788E mutant cells cultured at 24 °C (left) and 30 °C (right) overnight. g Measurements of cellular length, width and aspect ratio of the wild type as compared to wee1-G788E cells shown in (f). h S. japonicus cells after the shift from YE to EMM for 0, 4, 7 h and overnight. i Quantifications of cell length, width and aspect ratio at division before and after shift from YE to EMM overnight, for cells shown in (h). a, d, f, h Shown are single z-plane bright-field micrographs of live cells; scale bars represent 5 μm. b, c, e, g, i Quantifications presented as box plots with whiskers calculated by the Tukey method; n indicated in figures; p values derived from Kolmogorov–Smirnov test

