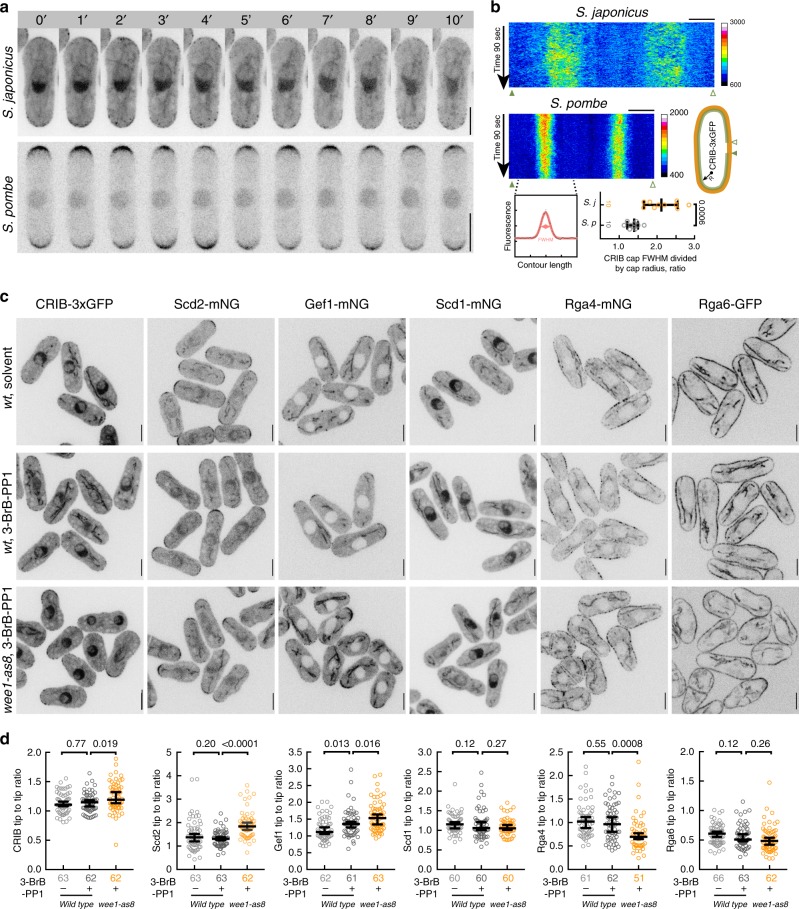
Fig. 2.
Activation zones of the small GTPase Cdc42 rescale during morphological transition. a Time-lapse montages of interphase S. japonicus (top) and S. pombe (bottom) cells expressing a Cdc42 activity reporter CRIB-3xGFP. Shown are maximum intensity z-projections of spinning-disk confocal images. b Representative kymographs of CRIB-3xGFP at cell periphery in both species (top). 16-Color calibration bars indicate fluorescence intensities in arbitrary units. A diagram showing FWHM fit (full width of the domain at half maximum, bottom left), normalized to cell tip radii (right). c Single plane spinning-disk confocal micrographs of cells expressing indicated fluorescent proteins in the wild type (wt) and wee1-as8 genetic backgrounds. Wild type cells were treated either with solvent control or 20 μM 3-BrB-PP1 for 2 h. wee1-as8 cells were treated with 20 μM 3-BrB-PP1 for 2 h. d Graphs show cellular tip-to-tip ratio in fluorescent intensities of markers shown in (c). Note that CRIB-3xGFP, Scd2 and Gef1 become enriched at the hyperpolarized cell tip upon Wee1 inhibition, whereas Rga4 is largely excluded from these growing cell protrusions. a–c Scale bars represent 5 μm. b, d Quantifications presented as 1D-scatter plots; black bars represent sample median with error bars indicating 95% confidence intervals; n indicated in figures; p values derived from Kolmogorov–Smirnov test

