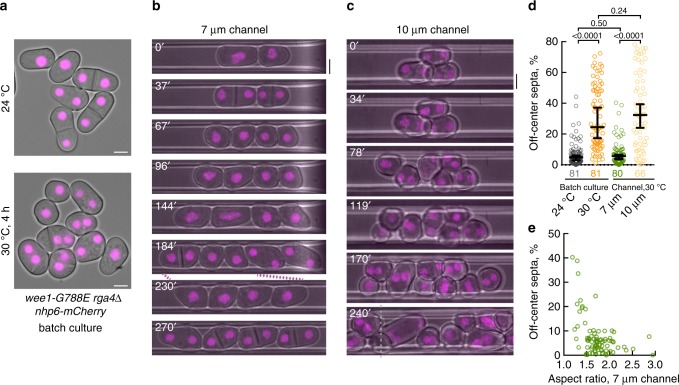
Fig. 4.
Cellular geometry dictates division site positioning in S. japonicus. a Nhp6-mCherry-expressing wee1-G788E rga4Δ cells grown in batch cultures at indicated temperatures. Shown are the pseudocolored epifluorescence images overlaid with bright-field. Note that these cells fail in cytokinesis plane positioning after incubation at 30 °C. b, c Nhp6-mCherry-expressing wee1-G788E rga4Δ cells grown in 7 μm (b) and 10 μm (c) channels, respectively, at 30 °C. Shown are the pseudocolored z-projected spinning-disk microscope images overlaid with bright-field. Time labels indicate minutes elapsed after cells grown at 24 °C in batch culture were loaded in channels at 30 °C. Gray dotted line in (c) indicates the border of two merged images. d Graph summarizing the accuracy of division plane positioning of wee1-G788E rga4Δ cells after 4-h incubations shown in (a–c). e A plot showing deviation of division septa from the geometric center of the cell (y-axis) vs. cellular aspect ratio (x-axis) of individual cells after 4-h incubation at 30 °C in 7 μm channel. a–c Scale bars represent 5 μm. Quantifications presented as scatter plots. Black bars represent sample median with error bars indicating 95% confidence intervals; n indicated in figures; p values derived from Kolmogorov–Smirnov test

