Fig. 3.
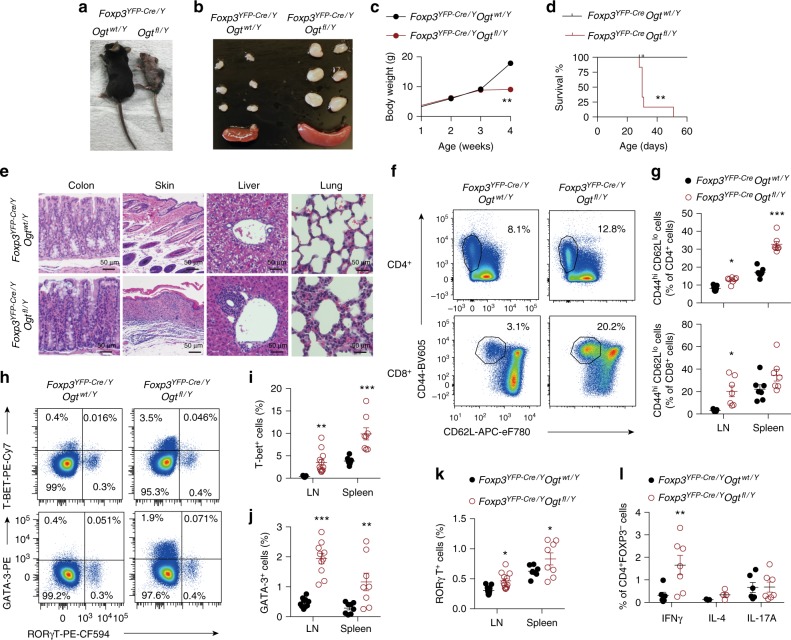
OGT-deficiency in Treg cells leads to a scurfy phenotype in male mice. a, b Representative images of 4-week-old Foxp3YFP-Cre/Y Ogtwt/Y and Foxp3YFP-Cre/Y Ogtfl/Y mice (a) and peripheral LNs and spleen (b). c, d Body weight curve (c, n = 5) and survival curve (d, n = 6) of Foxp3YFP-Cre/Y Ogtwt/Y and Foxp3YFP-Cre/Y Ogtfl/Y mice. e Representative images of H&E staining of the colon, skin, liver, and lung from 4-week-old Foxp3YFP-Cre/Y Ogtwt/Y and Foxp3YFP-Cre/Y Ogtfl/Y mice. f, g Representative flow cytometry plots showing CD44hiCD62Llo effector T cells among CD4+ (top) and CD8+ (bottom) T cells in the LNs (f) and quantification of the frequencies in the LNs and spleen of 2-week-old Foxp3YFP-Cre/Y Ogtwt/Y and Foxp3YFP-Cre/Y Ogtfl/Y mice, at least n = 6 each group (g). h–k Representative flow cytometry plots showing T-BET+, GATA3+ and RORγT+ cells among CD4+ T cells in the LNs (h) and quantification of the frequencies of T-BET+ cells (i), GATA3+ cells (j) and RORγT+ cells (k) in the LNs and spleen of 2-week-old Foxp3YFP-Cre/Y Ogtwt/Y and Foxp3YFP-Cre/Y Ogtfl/Y mice were shown, n = 8 each group. l Frequencies of IFNγ+, IL-4+ and IL-17A+ cells in CD4+FOXP3- T cells stimulated with PMA/lonomycin in the LNs of 2-week-old Foxp3YFP-Cre/Y Ogtwt/Y and Foxp3YFP-Cre/Y Ogtfl/Y mice, at least n = 3 each group. Data are shown as mean ± s.e.m. *p < 0.05; **p < 0.01; ***p < 0.001 by unpaired student’s t-test (c, g, and i–l) and Kaplan-Meier Analysis (d)

