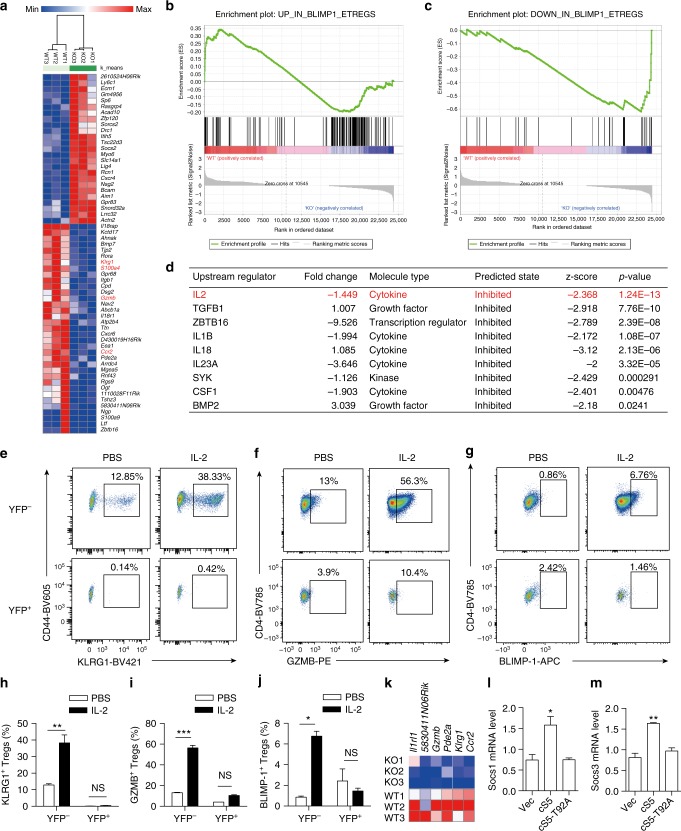
Fig. 6.
Attenuated IL-2/STAT5 signaling in OGT-deficient Treg cells. a Hierarchical clustering of top differentially expressed genes (60 genes with FDR q values less than 0.1) between OGT-sufficient and OGT-deficient Treg cells using Morpheus. b, c Enrichment plots for up-regulated (b) and down-regulated (c) genes in Blimp1+ eTreg cells from the Gene Set Enrichment Analysis (GSEA) of differentially expressed genes between OGT-sufficient and OGT-deficient Treg cells. d Ingenuity Pathway Analysis (IPA) of predicted upstream regulators for observed changes in gene expression. e–j Foxp3YFP-Cre/wt Ogffl/fl female mice were injected with PBS or the IL-2 immune complex (n = 2–5) for 3 consecutive days and Treg cells were analyzed at day 6. Flow cytometry of CD44+KLRG1+(e), CD4+GZMB+ (f) and CD4+BLIMP-1+ (g) Treg cells among YFP−OGT-sufficient and YFP+ OGT-deficient Treg cells (CD4+CD25+GITR+) in LNs and spleen and corresponding frequencies in h–j. k Expression of STAT5-target genes in OGT-sufficient and OGT-deficient Treg cells. l–m mRNA levels of Socs1 (l) and Socs3 (m) in OGT-sufficient Treg cells after retrovirus infection as indicated, n = 3 each group. Data are shown as mean ± s.e.m. *p < 0.05; **p < 0.01; ***p < 0.001 by two-way ANOVA (h–j) and one-way ANOVA (l, m)

