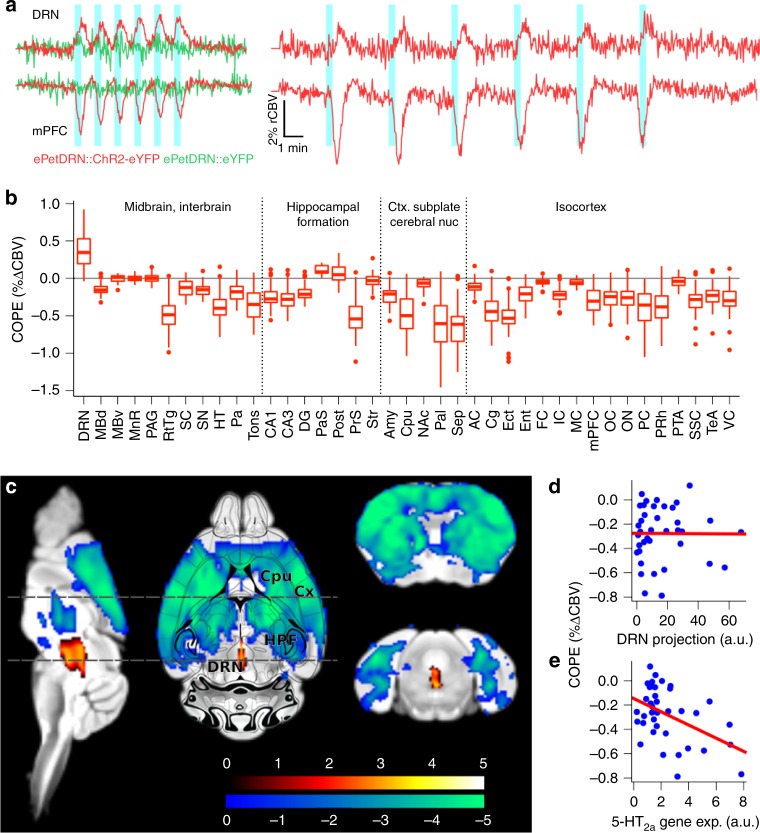
Fig. 2.
A whole-brain functional map of the DRN 5-HT circuit. a CBV traces from the DRN and medial prefrontal cortex (mPFC) during block stimulation with blue light (20 Hz, 5 ms pulse width, 6 × 20 s trains) during the short (ePetDRN::ChR2-eYFP, n = 10, ePetDRN::eYFP, n = 4) and long (ePetDRN::ChR2-eYFP, n = 7) fMRI protocols. b Contrast of parameter estimates (COPEs) extracted across 39 ROIs from ePetDRN::ChR2-eYFP using the short protocol (n = 10). They denote the relative response amplitude across the brain. Bound of box and centre line represent 25th, 50th, 75th percentiles, whiskers represent 1.5*inter-quartile range. c Second level voxel-wise analysis of ePetDRN::ChR2-eYFP (n = 10) against ePetDRN::eYFP (n = 4). Cx cortex, Cpu caudate-putamen, HPF hippocampal formation, DRN dorsal raphe nucleus. Colour scale = t-statistic (non-parametric test, p ≤ 0.05, cluster corrected). d, e COPEs extracted from 38 ROIs compared with d DRN projection field estimated with viral tracer and e 5-HT2A gene expression estimated with in-situ hybridization, both obtained from AIBS database

