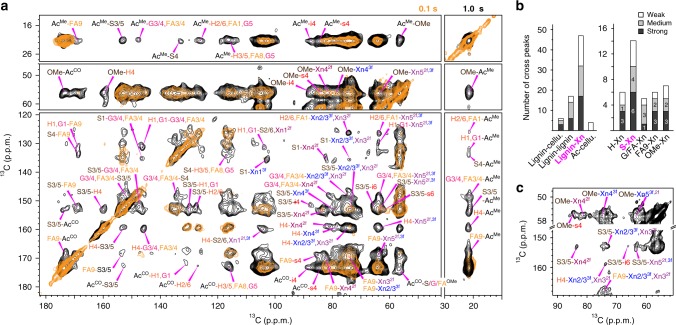
Fig. 2.
Electrostatic interactions of xylan and S units dominate lignin-polysaccharide interactions in maize. a Representative 13C–13C spectra measured with short (0.1 s, orange) and long (1 s, black) mixing times on maize. The 1-s spectrum shows many long-range intermolecular cross peaks that are absent in the 0.1-s spectrum. Only intermolecular cross peaks are labeled. b Summary of the 74 intermolecular cross peaks in maize. For each category, the peaks are grouped by their strength. Cellulose is abbreviated as cellu. The interaction types with the most cross peaks are highlighted in magenta. Lignin-xylan contacts dominate, with the most cross peaks for S. Source Data are provided as a Source Data file. c The Xn-S and Xn-OMe cross peaks in the 100-ms spectrum reveal close contacts

