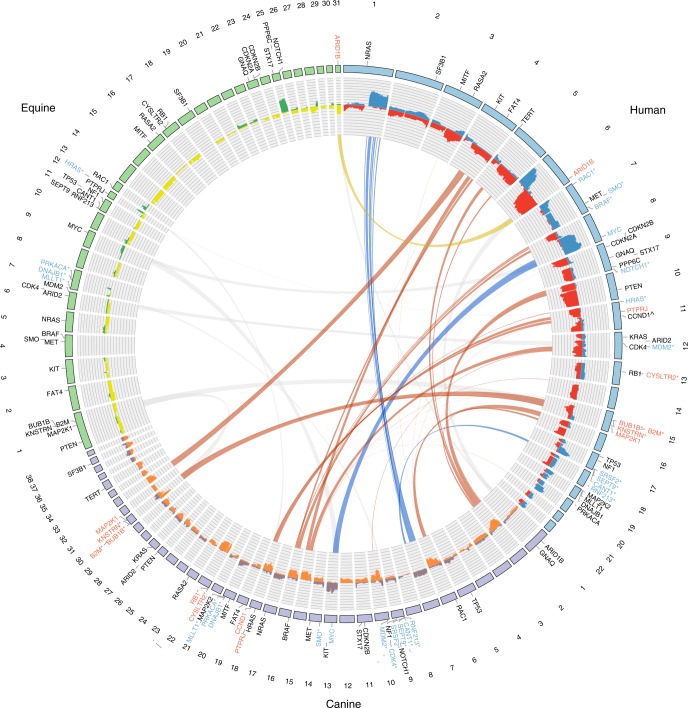
Fig. 5.
Cross-species comparison of somatic copy number alterations in melanoma. Equine cases used were from mucosal-like or mucocutaneous sites. Chromosomes are represented by the outer track. Genes shown are established or candidate melanoma genes. The histogram shows the frequencies of copy number (CN) gains (blue, purple, green) and losses (red, orange, yellow) in each species. The blue ribbons indicate regions of synteny on canine chromosomes and human chromosome arms that have a median frequency of CN gain of at least 0.2 in both species. Similarly, the orange and yellow ribbons indicate syntenic regions on canine and human chromosomes/arms, and on equine and human chromosomes/arms, respectively, with a median frequency of CN loss of at least 0.2 in both species. Gray ribbons show syntenic regions where the frequency of CN gain or loss was below 0.2. Genes shown in blue or red with an asterisk (*) are located within a significant focal CN gain or loss, respectively. The remaining genes in blue or red are located on chromosomes/arms in syntenic regions linked by blue or orange/yellow ribbons, respectively. ^CCND1 is on human chromosome 11, which had a frequency of CN loss>0.2, however, this gene is in focally amplified region from GISTIC 2.0 analysis with q-value = 0.11 (Supplementary Data 5)

