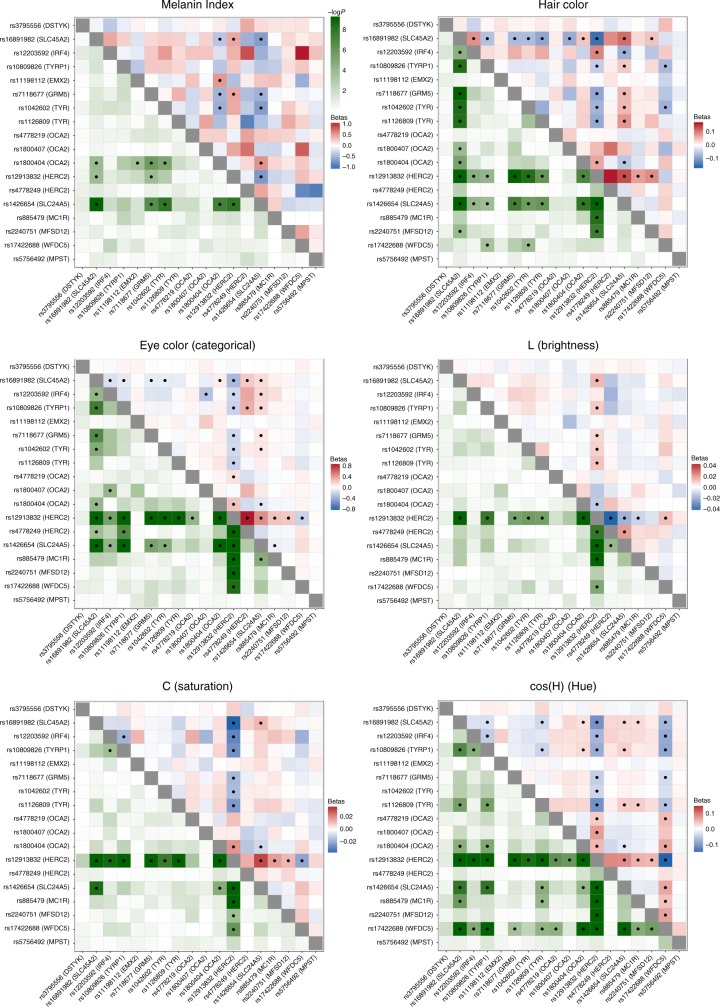
Fig. 5.
Heatmaps of statistical interactions between the 18 index SNPs identified here. Each panel corresponds to a different trait. The lower left triangle represents −log10 P values for the interaction term included in the regression model (with the color scale shown at the top). The upper right triangle represents regression beta-coefficients for each interaction term, colored from blue (negative effect) to white (no effect) to red (positive effect). As the scale for each trait is different, separate scales for effect sizes are shown next to each panel. Interactions that are significant (after Bonferroni correction) are marked with a black dot

